Business View
The Business view is the executive-facing overview of Beak Observability, reached from the Business / Full app toggle at the top of the application. Where the full app is the operator's working surface, the Business view answers a single question for a chosen company — what should we act on right now? — by rolling up availability, incidents, infrastructure, proactive predictions and security posture into a small set of decision-oriented tiles. Everything on the page is scoped to the company (and site) picked in the top bar, and the page only renders the domains that company actually has data for.
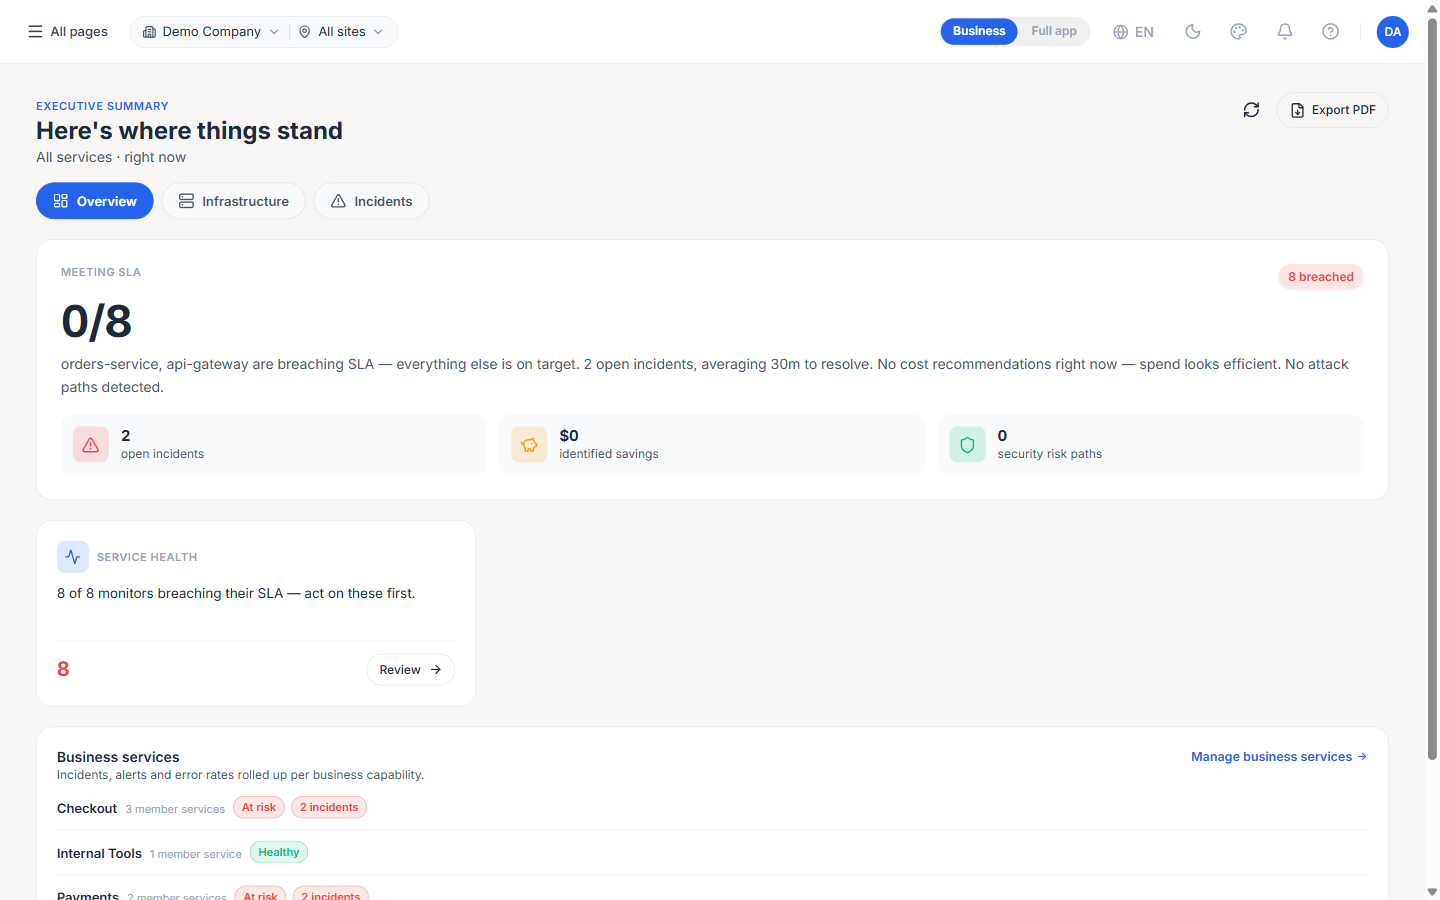
Switching to the Business view
Use the Business / Full app toggle in the top navigation. The Business view keeps its own tab set and is driven entirely by the company and site selectors beside it — changing the company re-scopes every tile and re-evaluates which tabs and cards are shown.
Company and site scope
Every figure on the Business view is scoped to the selected company and site. Availability, service health, cost and waste, service SLOs, infrastructure counts and all security findings reflect only the resources attributed to that company — so an executive for one company never sees another's numbers. Selecting a site narrows the same tiles further.
Note: Attribution is derived automatically from the telemetry — services carry their company and site from span tags, and cloud resources from the owning integration — so no manual tagging is required for a company's data to appear here.
Adaptive layout
The Business view is data-driven: a tab or card only appears when the selected company has data behind it, and the surface leads with what is most actionable. A company with monitors but no Kubernetes, no traces and no cost feed sees Availability, Alerts, Incidents, its cloud footprint and Security — and does not see empty Service-SLO, APM or host tiles. As a company's coverage grows, the corresponding tabs and cards appear on their own.
This means two companies can present very different Business views from the same platform, each showing only its real signal rather than a grid of zeros.
Note: Tiles never show a reassuring zero in place of missing or failed data. A tile whose data could not be loaded shows an error state with a retry, so an empty number always means "genuinely none," not "we couldn't check."
Overview tab
The landing tab is a set of headline cards for the selected company. Each card shows a single number, a short context line, and a Review action that drills into the matching full-app page.
- Service Health — The count of monitored services currently breaching their SLA. The number reflects what is actually faulty right now;
Reviewopens the SLA page filtered to the breached services so the offending items are the first thing on screen. - Alerts — Open critical alerts for the company.
- Incidents — Open incidents for the company.
- Security — Open security findings (see Compliance tab).
- Cloud footprint — Discovered and configured cloud resources for the company.
Cards that a company has no data for are hidden rather than shown at zero.
Prediction & Intelligence tab
A proactive-signals summary for the company — predicted failures, drift and anomaly signals, and the security-posture rollup — mirroring the platform's Predictions & Intelligence surface but scoped to the selected company. It appears only when the company has the underlying signal.
Infrastructure tab
An audit of the company's whole infrastructure estate, counting both configured and discovered resources. A company that has configured no infrastructure directly but has cloud resources discovered through an integration still sees an accurate estate here.
Each category is a clickable tile — Hosts, Windows / Linux, Containers, Kubernetes and Virtualization — that drills into the relevant page. The drill-in is source-aware: a discovered-only category lands on the page already filtered to the discovered view (for example Virtualization opens on its discovered tab, and Kubernetes on its cloud tab) rather than on an empty configured screen.
Note: A health count (for example "healthy") is shown only when the category carries a real health signal. Discovered-only cloud resources that have not been brought under active monitoring show their resource-type breakdown instead of a meaningless
0 healthy.
Incidents tab
The company's open and recent incidents, scoped to the selected company and site, with a Review drill-in to the full Incidents page.
Compliance tab
The security-and-compliance rollup for the company, headlined by open risk paths and three tiles. It surfaces the findings from the nightly Security Posture scan, scoped to the company — and, importantly, works for cloud-only companies that run no Kubernetes.
- Attack Paths — Exploitable paths from a public entry point to a resource, including cloud public-exposure paths (for example a VM or gateway reachable from the internet via a public IP).
- Compliance Controls — Failing CIS-style controls across the company's cloud estate.
- Privilege Escalation — Standing privileged access that could be abused.
Cloud security posture (non-Kubernetes)
For companies whose estate is cloud rather than Kubernetes, the Compliance tab is populated from the cloud inventory:
- Open ingress — Azure network security groups and AWS security groups with inbound rules open to the internet (
0.0.0.0/0or::/0). - Public storage access — Azure storage accounts and AWS S3 buckets that allow public access.
- Privilege escalation — Azure role assignments where a user or group holds a broad standing role (
Owner,ContributororUser Access Administrator). Assignments held by a service principal are treated as automation and are not flagged. - Public exposure — Cloud resources reachable from the internet via a public IP.
Note: Findings only appear for posture the platform was able to read. Where a cloud integration's credentials lack the read permission for a check (for example an AWS role without S3 or IAM read access), that check produces no finding rather than a false "pass" — so an empty result is never mistaken for a clean one.
Best Practices
- Set the company first — The whole view is company-scoped; confirm the top-bar company and site before reading any number.
- Lead with Service Health and Compliance — The breached-SLA count and the privilege-escalation / open-ingress tiles are the fastest route to "what is wrong now."
- Trust the empties — A hidden tab or a zero means genuinely no data or no findings; an error state (with retry) means a check could not run. They are deliberately distinct.
- Grant read-only cloud permissions for full posture — Public-storage and privilege checks depend on the integration's credentials having the relevant read scopes; without them those tiles stay empty by design.
- Re-check after remediation — Security and compliance findings refresh on the nightly scan, so confirm a closed exposure the following day.
Related Pages
- Dashboard — The operator's single-pane overview in the full app
- Security Posture — The full findings surface the Compliance tab summarises
- Predictions & Intelligence — The proactive-signals hub, scoped here per company
- Cloud — Cloud integrations and the discovered resource inventory
- Incidents — The full incident queue
- Admin · Companies — Where companies and their scoping are managed