Reports
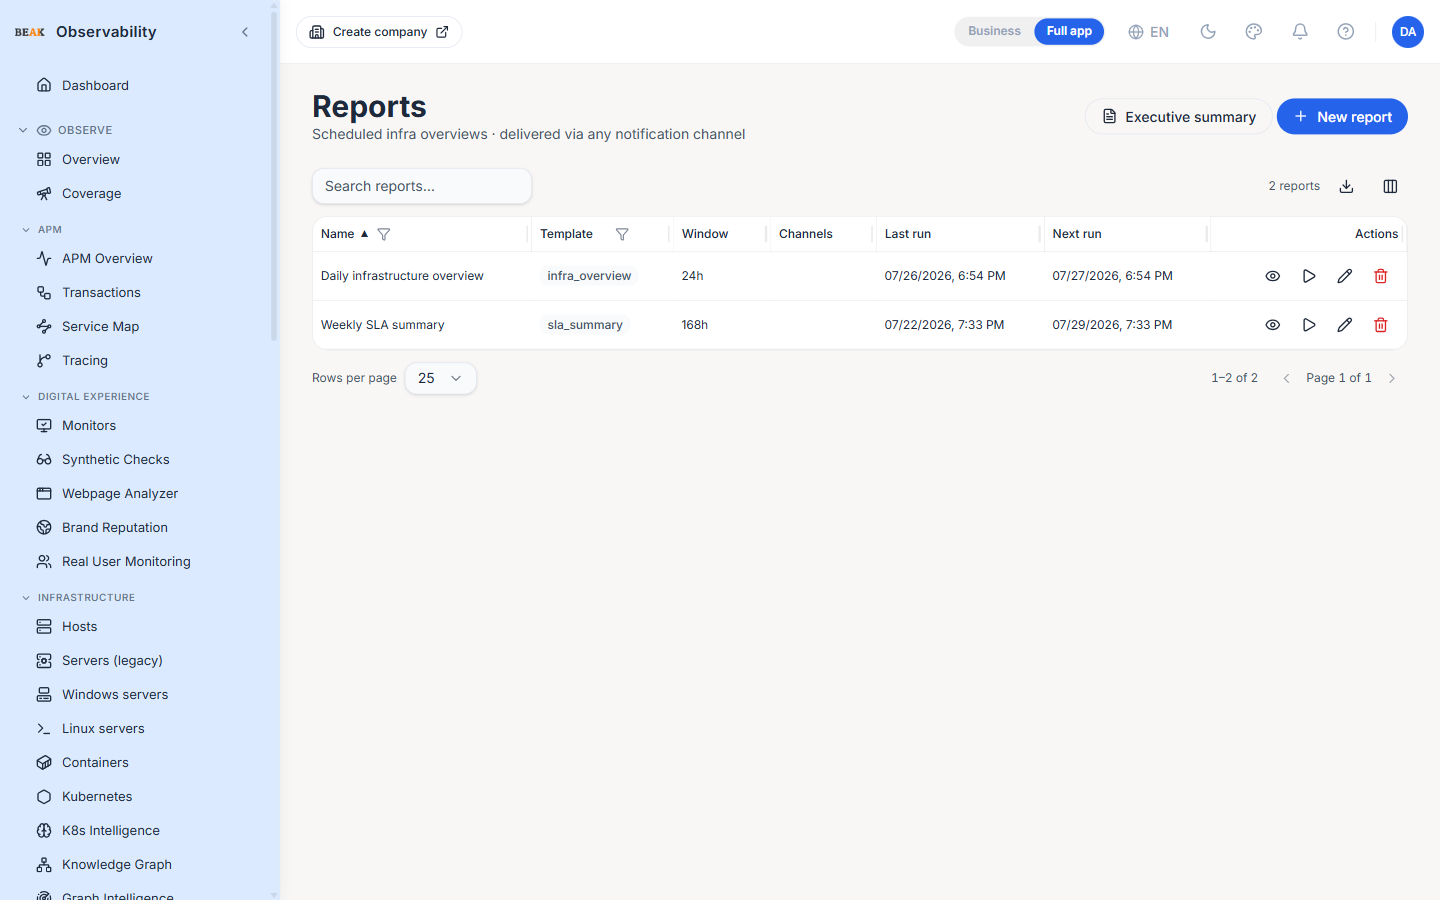
The Reports page lets operators schedule recurring reports and deliver them to one or more notification channels. Reports cover infrastructure rollups, SLA summaries, and incident reviews; they run on the configured cadence and are also one-click runnable on demand.
Report Templates
The following templates are available:
- Infrastructure overview — Host health, agent inventory, top resource consumers and recent incidents
- SLA summary — Per-monitor uptime against the configured SLA target, breach counts and the worst-performing targets
- Incident review — Open and recently closed incidents grouped by severity, with source-of-truth ITSM links where available
- Executive summary — A plain-language, leadership-oriented roll-up: an overall health headline, the key counts, and a single ranked "what to act on now" list (no cost data)
Executive Summary
The Executive summary button in the page header opens a read-only, non-technical overview built for leadership — no scheduling or channel required. It reads the current window live and shows:
- Health banner — A single traffic-light headline:
Action needed(monitors down or a critical incident open),Monitor closely(open incidents, degraded monitors, at-risk services or SLA breaches), orAll systems healthy - KPI band — Monitors down, Open incidents, SLA breaches, At-risk services, Monitors up, Hosts online, and 24-hour Uptime (no cost data — out of scope for this view)
- What to act on now — A single ranked list merging down monitors, imminent or breached SLAs, predicted failures, and expiring certificates, each with a plain-language reason
- Recent open incidents — The most recent open incidents with severity and age
Use the Export PDF action to download the summary for sharing. The same content is also available as the Executive summary scheduled-report template for automated delivery to a channel.
Schedule
The window selector picks the period each run covers:
- Last 1 hour
- Last 24 hours
- Last 7 days
Reports run automatically — the row shows Last run and Next run timestamps so the operator can verify the cadence is firing.
Channels
Reports deliver to one or more notification channels — Slack, Microsoft Teams, email, PagerDuty, webhooks, and any other channel defined on the Alerts → Channels tab. A report can target multiple channels; each channel receives the same payload.
Actions
Each row exposes:
- View — Open the rendered report inline, in-app, without waiting for a scheduled delivery or configuring a channel
- Run now — Generate and deliver the report immediately, regardless of schedule
- Edit — Change the report's name, template, window, or channels
- Delete — Remove the report definition (confirmation required)
Creating a Report
The New report button opens a dialog with four fields:
- Name — Display name
- Template — Infrastructure overview / SLA summary / Incident review / Executive summary
- Window — Last 1 hour / 24 hours / 7 days
- Notification channels — Pick one or more from the existing channel list
If no channels exist, the dialog prompts the user to create one first.
Best Practices
- Name reports after their delivery audience (e.g.
Weekly SLA — Customer Operations) so the rows are scannable. - Use the 7-day window for SLA reports — short windows have small denominators and produce noisy ratios.
- Pair an Infrastructure overview report at the start of the week with an Incident review at the end of the week to bookend the reporting cadence.
- The
Run nowaction is the right choice for ad-hoc requests — it doesn't disturb the schedule and the recipient sees the report immediately.
Related Pages
- Alerts — Notification channel setup
- Predictions & Intelligence — Predicted failures and forecasts feeding the executive summary
- Incidents — Source of the incident-review data
- Monitors — Source of the SLA summary
- Hosts — Source of the infrastructure rollup