Cloud
The Cloud integrations page (route /cloud) is the home for every cloud integration the tenant connects — AWS, Azure, GCP and Mongo Atlas. The lead is "Click an integration to browse its resources by category." The page lists the connected accounts, lets you connect new ones via the Connect account button, and drills into each account's discovered resources by category (compute, storage, database, network, cost, etc.).
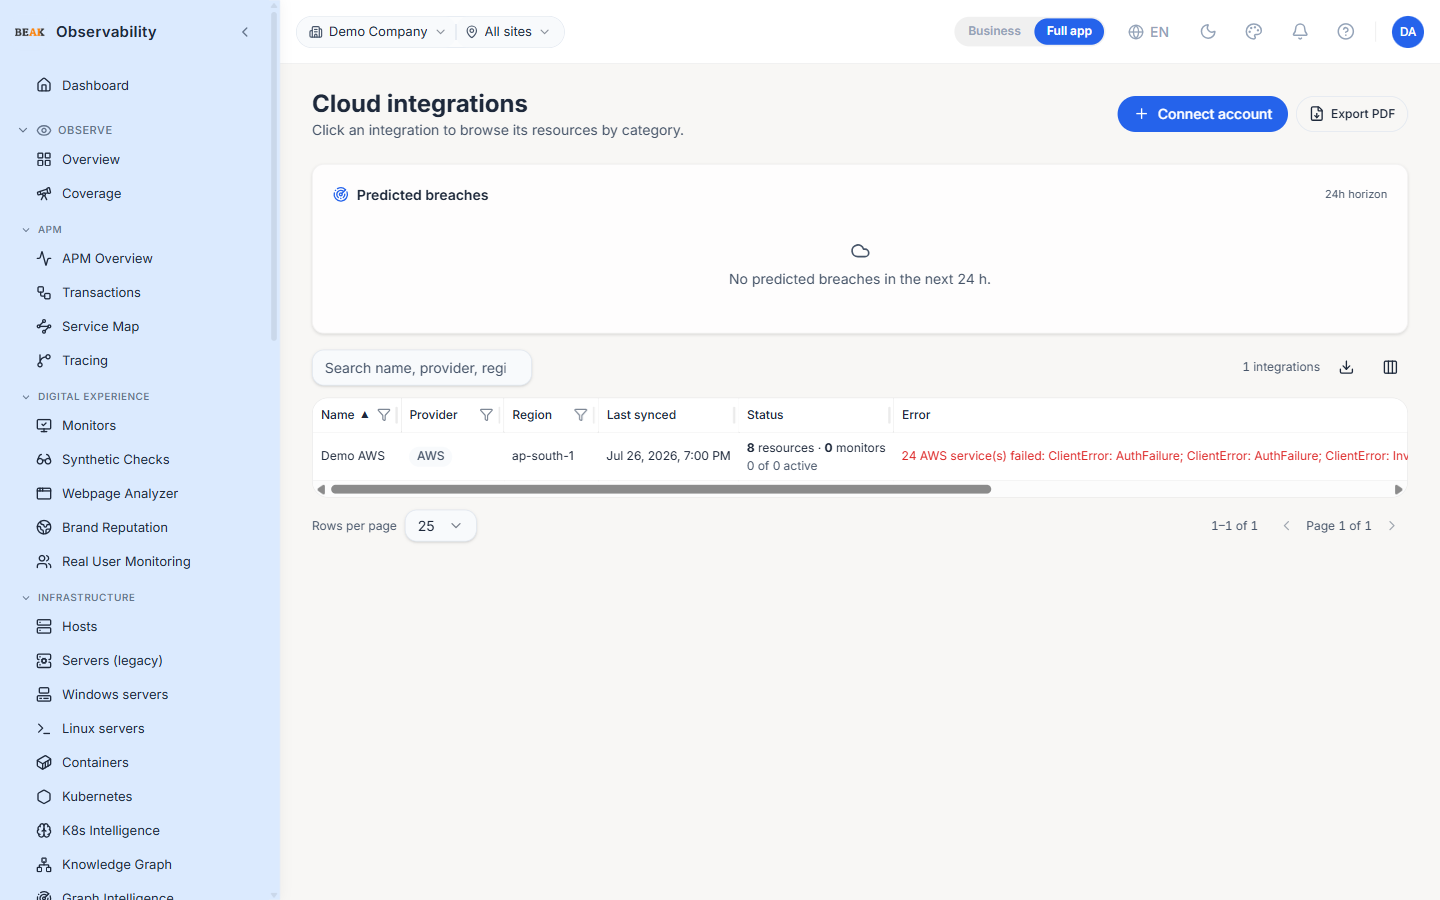
Integrations Table
Each connected account is one row. Columns:
| Column | Description |
|---|---|
| Name | Display name given when the account was connected |
| Provider | AWS / Azure / GCP / Mongo Atlas |
| Region | Region for AWS; populated per-resource for Azure / GCP / Atlas |
| Last synced | Relative time since the last inventory walk |
| Status | syncing, synced or failed |
| Error | Most recent sync error, blank when healthy |
| Actions | Edit, sync, configure ingest, delete |
Predicted Breaches
The Predicted breaches panel surfaces resources the platform predicts will hit a metric breach in the next twenty-four hours. The forecast is built from the platform's anomaly-detection layer and surfaces tenant-wide.
Connect an Account
The Connect account button opens a provider-specific form:
- AWS — Region, access key ID, secret access key
- Azure — Tenant ID, client ID, client secret; subscription ID is optional and narrows discovery to a single subscription
- GCP — Project ID and the service-account JSON key
- Mongo Atlas — Public key, private key and the organization ID
Once saved, the platform kicks off an asynchronous inventory walk. The integration row shows syncing while the walk runs, then flips to the resource count.
Edit an Integration
The edit (pencil) action on an integration row — or on the integration detail header — opens a dialog for the account's full connection configuration, not just its name:
- Name — the display name shown in the table.
- Credentials — the provider's connection identifiers and secrets (Azure
tenant / client / secret / subscription, AWS access key / secret, GCP project
and service-account JSON, or Atlas keys). Stored secrets are shown masked
(
********); leave a secret unchanged to keep the stored value, or type a new one to replace it. - Region — AWS only; Azure / GCP / Atlas resolve region per resource.
- Enabled — turn the integration on or off. A disabled integration stops polling and ingest without losing its configuration or discovered inventory.
The provider cannot be changed on an existing integration — switching it would orphan every resource and monitor already discovered under the account. To move to a different provider, delete the integration and connect a new one.
Secrets never leave the platform in the clear: the form only ever loads masked placeholders, and unchanged masked values are preserved on save. New credentials take effect on the next poll — the credential cache refreshes automatically. Renaming to a name already used by another integration in the same tenant shows an inline error.
Sync
Each integration row has a Sync action. Sync runs are non-blocking — the row's sync_status updates as each provider page is fetched. The first sync can take up to several minutes for a wide tenant; subsequent syncs are incremental and finish in seconds.
Ingest Pipelines
Each connected provider exposes additional ingest pipelines beyond the inventory walk:
- Azure — Activity Log, topology, Log Analytics → OTel logs, event-hub stream
- AWS — CloudWatch Logs, X-Ray
Open the integration's Configure ingest dialog to wire these pipelines. The dialog uses dropdowns populated from the live ARM / AWS API so operators don't have to paste GUIDs or workspace IDs by hand.
Drill-Down
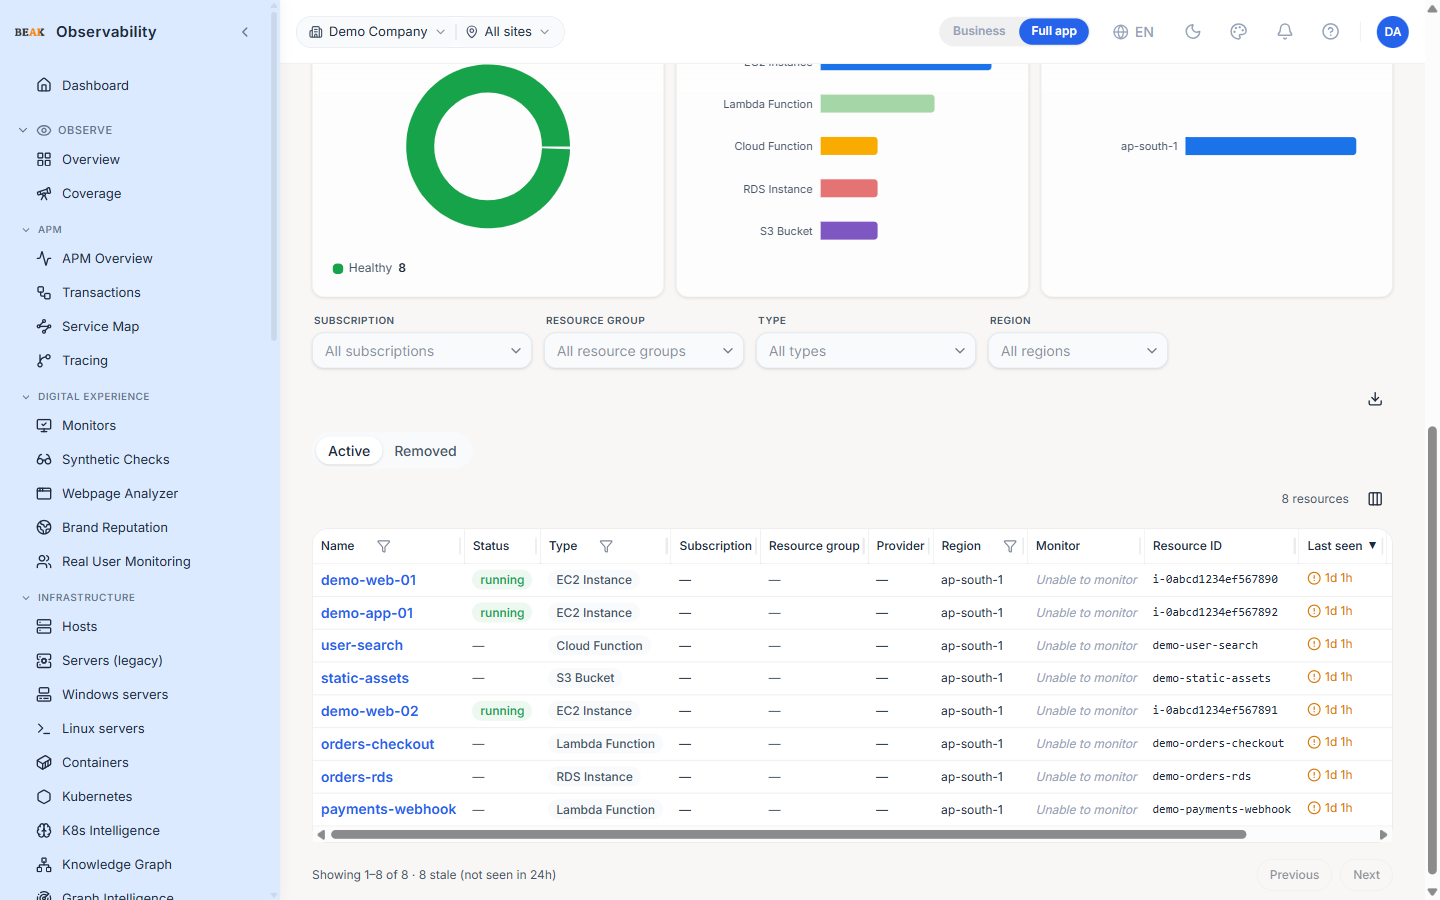
Clicking an integration name opens its drill-down view — resources grouped by category (Compute, Storage, Database, Network, Containers, Security, Cost). Each card shows the resource count and the last-seen timestamp; clicking opens the resource list with the category pre-filtered.
The ?integration=<uuid> URL parameter makes the drill-down view bookmarkable, and ?type=<resource_type> narrows further to a single resource kind.
The drill-down's Types tile counts the distinct resource types discovered in that account. Clicking it opens the Cloud Types Reference in coverage mode — scoped to this account, it shows which of those discovered types Beak monitors and which aren't covered yet, reconciling the tile's count.
Resource types are shown as friendly service names — Virtual Network Link, Storage Account, EC2 Instance — instead of the raw provider identifier (microsoft.network/privatednszones/virtualnetworklinks, ec2:security-group). Hover any type to see the exact technical type; the raw value is what filtering and search still match on, so nothing changes about how you query. The list also remembers your filters, sort and category selection when you open a resource and navigate back, so a drill-down survives round-trips to the detail page.
Resource Detail
Clicking a resource row opens its detail view (route /cloud-resources/<id>). The header shows the resource name, its friendly type (raw type on hover), the lifecycle status, and — when a monitor is correlated — a monitor badge.
Four tabs organise the view:
- Overview — Provider, region, status, last-seen time and the full resource ID, plus the Health & activity panel and the resource's raw attributes and tags.
- Metrics — Every metric ingested for the resource, each chartable, over a shared time range.
- Logs — OpenTelemetry log records scoped to the resource.
- Traces — Spans correlated to the resource.
Note: Lifecycle status values display in a readable form (
Succeededrather than the rawProvisioningState.SUCCEEDED).
Health & Activity
The Health & activity panel on the Overview tab explains, in plain language, why a resource is healthy or needs attention:
- Why this status — The status badge plus a headline (
This resource looks healthy.,This resource needs attention., orThis resource is in a critical state.) driven by the resource's lifecycle state and its correlated monitor's signals (a failing health check, a forecast breach). Inventory staleness — the poller has not re-catalogued the resource within its window — is shown as an informational note and does not by itself mark a resource as needing attention. - Alerts & incidents — A tally of the alerts and incidents raised for the resource's correlated monitor, counting both monitor-scoped alerts and auto-generated ones (no-data, anomaly, flapping). Click the Alerts or Incidents count to open a popup listing the individual records — severity, state, identifier and time — including resolved ones that the main Alerts list retains but does not surface prominently.
Filters
The top-bar dropdown filters the list by provider. The deeper resource list inside a drill-down filters by category and by provider-specific resource type.
Best Practices
- Use a least-privilege role / service principal per integration — connect them as read-only and let the inventory + ingest pipelines do the rest.
- Wire the ingest pipelines (Activity Log, CloudWatch Logs, X-Ray) only after the inventory walk has finished so the dropdowns populate with the right targets.
- The drill-down view is the right place for capacity reviews — the categories aggregate cross-provider, so storage and compute totals reconcile across AWS / Azure / GCP at a glance.
- A failed sync usually means the credentials have rotated or the role lost a permission — re-test the credentials before re-syncing.
- Use a resource's Health & activity panel as the first stop when triaging — the Alerts / Incidents popup lists that resource's records (including resolved ones), which is faster than scanning the tenant-wide Alerts list.
Related Pages
- Connectors — Connector catalog and per-source setup instructions
- Databases — Cloud-managed database discovery driven by these integrations
- Monitors — The correlated monitors that drive a resource's health and metrics
- Alerts — Tenant-wide alert list behind the resource Alerts count
- Incidents — Promoted incidents behind the resource Incidents count