Hosts
The Hosts page sits under the OBSERVE · INFRASTRUCTURE eyebrow with the lead "Servers reporting through the Beak agent". It lists every infrastructure host the agent has registered for the tenant. Each row shows the current resource usage (CPU, memory, disk), the OS / IP, and the time of the last agent check-in. The table refreshes every ten seconds. A Register host button in the top right opens the host registration dialog.
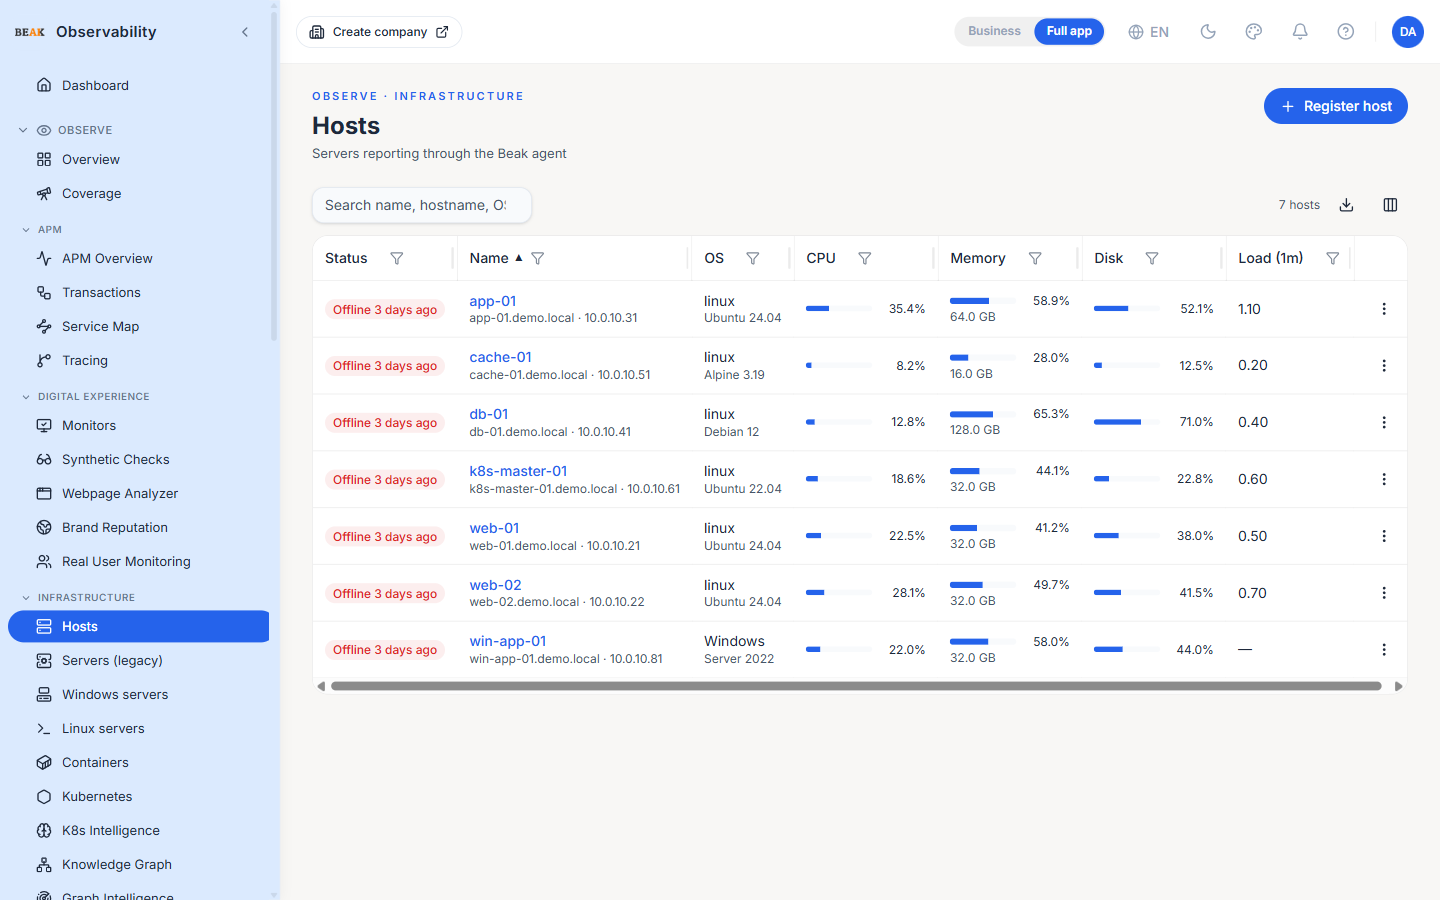
Status Vocabulary
Each row is derived to one of three states:
online— Agent checked in within the last 120 secondsoffline— Agent registered but has not reported within the last 120 secondspaused— Host was paused by an operator; the agent is still installed but the dashboard ignores it
Columns
- Status — Online / offline / paused with the matching colour chip
- Name — Host display name; the hostname and IP are shown beneath as secondary text. Clicking the name opens the host detail view
- OS — OS family and version
- CPU — Last-seen CPU utilisation with a meter; the bar turns amber above 75 percent and red above 90 percent
- Memory — Last-seen memory utilisation with the same banding; total physical memory is shown beneath
- Disk — Last-seen disk utilisation, same banding rules
- Load (1m) — Linux load average for the last minute
The row's overflow menu exposes Pause, Resume and Delete actions for users with the matching permission.
Filtering and Drill-Down
The ?status=online|offline|paused URL parameter pre-filters the table when a user arrives from the Dashboard. A chip near the title shows the active filter and offers a one-click clear.
Per-column funnel filters work alongside the URL filter and support multi-chip selection on Status and OS.
Host Detail
Clicking a host name navigates to the host detail view — the same metric meters at higher fidelity, the time-series charts for CPU / memory / disk / network, and the agent metadata (hostname, IP, OS version, last reboot).
Best Practices
- Sort by
CPUorMemorydescending during a capacity review to surface the top consumers across the fleet. - A long-
offlinehost is more often an agent issue than a hardware issue — start by checking that the host agent is still running. - Use the URL pre-filter (
?status=offline) as a saved link in on-call runbooks so the team always lands on the right scoped view. - Pause hosts before scheduled OS maintenance so the alerting pipeline doesn't fire a string of probe failures.
Related Pages
- Containers — Docker containers reported by the same agents
- Kubernetes — Container orchestrator topology and pod metrics
- Alerts — Alert rules that key off host metrics