Dashboard
The Dashboard is the landing page for Beak Observability. The page sits under the OBSERVE · OVERVIEW eyebrow and is a single-screen rollup of monitor health, the host fleet, active incidents, Kubernetes intelligence, cloud integrations and FinOps cost recommendations. It refreshes every fifteen seconds so on-call teams can keep it open during a triage window.
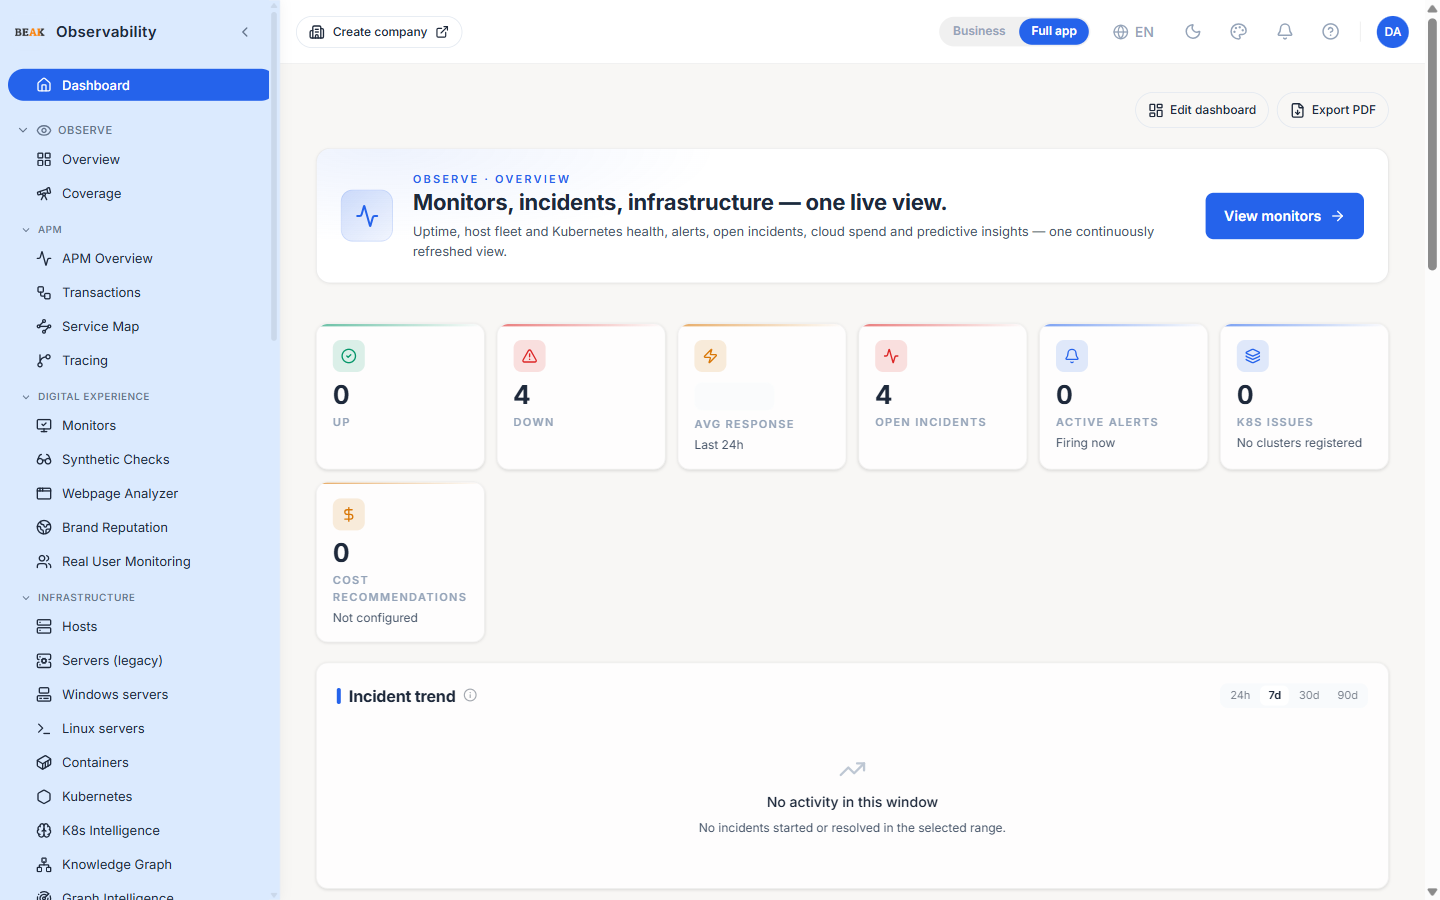
The page lead summarises the surface as "Monitors, incidents, infrastructure — one live view. Uptime, host fleet and Kubernetes health, alerts, open incidents, cloud spend and predictive insights — one continuously refreshed view."
Hero Strip
The hero strip at the top of the page summarises the tenant at a glance. Each tile is clickable and deep-links to the underlying page with the relevant filter pre-applied.
- UP — Count of synthetic monitors currently passing
- DOWN — Count of synthetic monitors currently failing
- AVG RESPONSE — Average HTTP response time over the last twenty-four hours
- OPEN INCIDENTS — Active cases in the rule engine plus ingested incidents from connected ITSM systems
- ACTIVE ALERTS — Alerts currently firing across rule-engine and ingested sources
- K8S ISSUES — Total problem count across open incidents, firing third-party alerts, restarting pods and not-ready nodes; reads "No clusters registered" before any cluster is added
- COST RECOMMENDATIONS — Open FinOps recommendations; reads "Not configured" before the FinOps integration is wired up
A View monitors action sits next to the strip for one-click navigation into the full monitor list.
Incident Trend
The incident trend chart plots how many incidents started and resolved over the selected window. Toggle the time range with the 24h / 7d / 30d / 90d buttons.
Active Incidents
A consolidated feed combining synthetic monitors that have flipped to down and rule-engine incidents in the open state. The first eight rows are shown — clicking any row opens the matching monitor or jumps to the Incidents page. A View all link sits alongside the section header.
Top K8s Problems
Pulled from the K8s Intelligence service. The list mixes four problem types:
- Open incidents — Rule-engine incidents scoped to Kubernetes targets
- Node pressure — Nodes flagged as
NotReady - Ingested alerts — Open third-party alerts (Datadog / Splunk / etc.) tagged to a Kubernetes target
- At-risk pods — Pods restarting more than the configured threshold in the last hour
The section header carries an Open intelligence action that jumps to K8s Intelligence. Clicking any row navigates with the target pre-selected.
Cloud Integrations
A Cloud integrations panel summarises every connected cloud account. The Manage action opens the Cloud page for adding or editing integrations.
Top Noisy Alert Sources
The noisiest alert sources panel ranks the alert sources contributing the most volume in the window. Use it to identify rules that need tuning. The View alerts action jumps to the full Alerts feed. The data is sourced from the K8s Intelligence aggregation service.
Infrastructure
The infrastructure rollup at the bottom of the dashboard summarises the host fleet:
- TOTAL — Total registered hosts
- ONLINE — Hosts that have reported within the last 120 seconds
- OFFLINE — Hosts that have not reported within the window
- AVG CPU — Mean CPU utilisation across online hosts
- AVG MEM — Mean memory utilisation across online hosts
The View all hosts action jumps to the Hosts page.
Predictive Intelligence
Four compact, clickable panels surface the platform's forward-looking signals so on-call teams can act before something breaks. Each panel summarises the top items and links through to its full page:
- Predicted Failures — Entities most likely to fail soon, ranked by a 0–100 risk score. Opens Predictions & Intelligence.
- Anomaly & RCA — Monitors whose recent behaviour deviates most from their baseline, ranked by severity. Opens the Anomaly & RCA page.
- Predicted Breaches — Monitors forecast to miss their SLA target, showing time-to-exhaustion or a
Breachedflag. Opens the SLA page. - Top Unhealthy Monitors — Monitors currently
down,warn,probe_errororconfig_error, so the worst offenders are one glance away. Opens the Monitors list.
Each panel refreshes on its own cadence and only queries data while it is visible. Like the other dashboard panels, each can be reordered or hidden with the Edit dashboard control.
Note: These panels replace the former "Top monitors" table, which only duplicated the monitor list one click away. The Up / Down hero tiles still deep-link into the full Monitors page.
Best Practices
- Keep the Dashboard open on a wall monitor during incident response — the 15-second refresh cadence makes it a live ops board.
- If the K8s tile reads zero but the team knows a cluster is unhealthy, check that the cluster is registered in Kubernetes and that the Kubernetes Intelligence collector is configured.
- The FinOps tile only renders when the FinOps integration is enabled — see FinOps for setup.
- Click-through is faster than the sidebar for triage — every tile and row is a jump-off point.
Related Pages
- Monitors — Synthetic monitor inventory and edit flows
- Hosts — Infrastructure host fleet
- Incidents — Unified incident feed (rule engine + ingested)
- Predictions & Intelligence — Predicted failures, anomalies, forecasts and SLA breach ETAs
- K8s Intelligence — Past / current / predicted Kubernetes problems
- FinOps — Cost recommendations and anomalies
- Beak Observability Overview — High-level product overview