Incidents
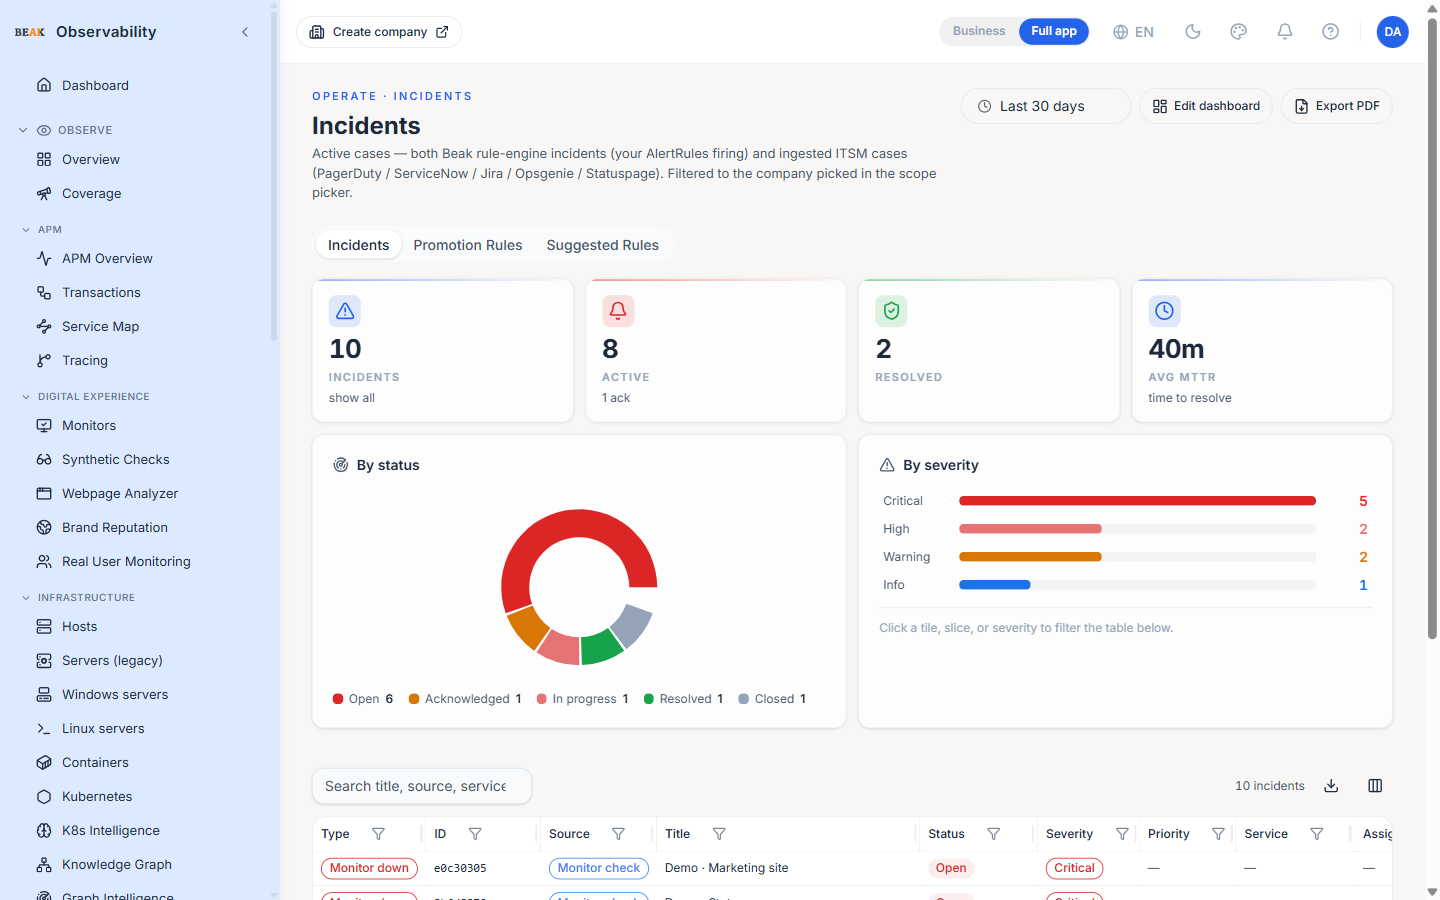
The Incidents page sits under the OPERATE · INCIDENTS eyebrow with the lead "Active cases — both Beak rule-engine incidents (your AlertRules firing) and ingested ITSM cases (PagerDuty / ServiceNow / Jira / Opsgenie / Statuspage). Filtered to the company picked in the scope picker."
Three distinct sources merge into one table:
- Rule-engine incidents — Cases the alert engine opens on top of one or more firing alerts
- Ingested incidents — Pulled from PagerDuty, ServiceNow, Jira, Opsgenie or Statuspage via the platform's incident-ingest API
- Monitor outages — Synthetic monitors that flipped to
down
Note: Rule-engine promotion is governed by the AI incident promoter, which is off by default and resolved per company (the global toggle under Settings is the org-wide default; a company can override it). While it is off for a company, that company's rule / Kubernetes / forecast criticals stay on the Alerts page and are not auto-promoted into incidents until an operator opts the company in. Ingested ITSM incidents and monitor outages are unaffected.
A single Type column distinguishes the three; everything else (severity, status, time, title, source) is normalised so the operator can scan in one pass.
Tabs
The page is organised into three tabs:
- Incidents — The unified incident table (the default).
- Promotion Rules — Rules that govern which firing alerts the AI incident promoter turns into incidents.
- Suggested Rules — Promotion rules the platform suggests from observed alert patterns; accept one to materialise it.
Time Window
The window selector (1 d / 7 d / 30 d / 90 d) drives the server-side started_at filter. The default window is thirty days.
Columns
| Column | Description |
|---|---|
| Type | rule / ingested / monitor_down |
| Display ID | Human-friendly incident id (INC-…, or the monitor id) — shown by default |
| UUID | Raw internal identifier — hidden by default; enable via the column picker to correlate with the API or logs |
| Source | "Beak rule engine", ITSM provider name, or "Monitor check" |
| Title | Incident summary |
| Status | open / acknowledged / in_progress / resolved / closed |
| Severity | critical / high / warning / info |
| Priority | ITSM priority — populated for ingested rows |
| Service | Affected service — populated for ingested rows |
| Assignee | Assignee — populated for ingested rows |
| Opened | Relative time since the incident opened |
| Resolution note | Why a resolved incident was closed — empty otherwise |
| Custom | Free-form attributes from custom_data (ingested) or details (rule) |
| Link | External source URL for ingested rows |
The table is sorted newest first (by Opened, descending) by default. The optional columns (UUID, and others) are toggled from the column picker and remembered per user.
Detail Dialog
Clicking an ingested incident opens the detail dialog — full payload, notes, custom_data viewer and the link back to the source ITSM system. Once an incident is resolved, the dialog also shows its resolution note (why it was closed). Rule-engine and monitor-down rows do not open the detail dialog (their long-term home is the Alerts page deep link), but the row's Custom column has an inline View action for the captured details.
Company & Site Scoping
The TopBar scope picker filters the incidents page too — picking a company scopes every source (rule-engine, ingested ITSM, monitor-down) via the X-Company-ID header, and picking a site adds the X-Site-ID filter. Switching either instantly re-scopes the table.
The site selector defaults to All sites, which sends no site filter — so incidents with no site (from an org- or company-scoped ingest key) stay visible. Narrow to a specific site to focus on one location.
Export
The Download report action emits a CSV of the visible rows (post-filter, post-search, post-window). Each source is capped server-side at two hundred rows, so the combined export tops out at six hundred; a notice line appears in the CSV when any source hit the cap.
Best Practices
- Sort by
SeveritythenStarteddescending for a priority-ordered triage view. - Use the Company scope picker before opening this page — a tenant-wide view is noisier than a per-company view in MSP-style deployments.
- The
Originfilter is the quickest way to separate "things my team owns" from "things upstream is paging us on" — pickmonitor_downfor ours,ingestedfor theirs. - Resolved-window reviews work best at the 30-day window; week-over-week comparisons are surfaced more cleanly on the Reports page.
Related Pages
- Alerts — Firing alerts that feed rule-engine incidents
- Ingested Incidents — Source-scoped view of just the externally-ingested incidents
- K8s Intelligence — K8s-scoped slice of the same data
- Settings — Incident ingest setup (PagerDuty / Jira / etc.)