Beak NOC — Network Operations Center
Beak NOC is a comprehensive, cloud-hosted Network Operations Center platform that gives your team unified visibility across every layer of your network infrastructure. From real-time device health and WAN link performance to security posture scoring, configuration drift detection, and deep packet inspection — Beak NOC consolidates all critical network data into a single pane of glass.
Key Capabilities
Real-Time Network Monitoring
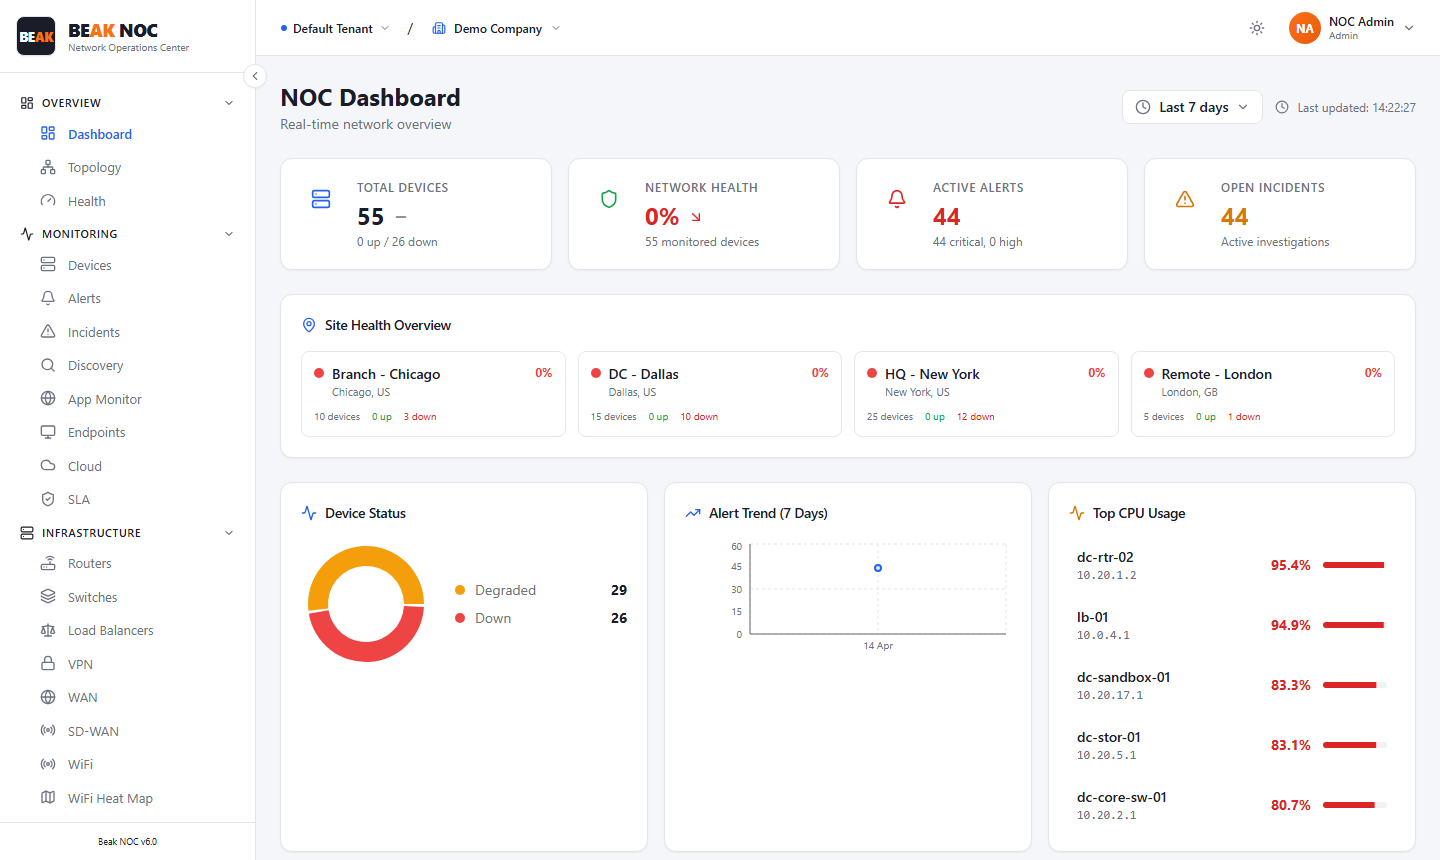
Track every device on your network with live status polling. The NOC Dashboard surfaces total device counts, network health percentage, active alert counts, and open incidents at a glance — refreshed continuously so your operators always see current state.
Multi-Phase Network Discovery
Automatically discover every device on your network using ARP, Ping, TCP port scanning, mDNS, SNMP, and SSH fingerprinting. Choose from six scan modes ranging from a fast Ping Sweep to Full Discovery, schedule recurring jobs, and store credentials centrally for SNMP, SSH, and WinRM targets.
Visual Network Topology
Build a live map of your network showing devices as nodes and links as edges. Filter by device status (Up/Down) or type, zoom into segments, and export the map for documentation or compliance reviews.
Security Operations Center
Score your network's security posture with a composite letter grade. Monitor threat activity, insider risk signals, AI-driven risk assessments, vulnerability and virtual patching status, compliance posture, policy execution, and port exposure across your entire estate — all consolidated into a single scored dashboard.
WAN Link Performance
Monitor all Wide Area Network links with per-link latency, jitter, and packet loss metrics. Track link health state, view latency trends per link, and measure SLA compliance per path across all site-to-site connections.
Configuration Backup & Drift Detection
Automatically back up device configurations on a schedule. Detect configuration drift immediately when a device's running config deviates from its last known-good baseline. View per-device version history and diff any two backups to see exactly what changed.
Network Flow Analysis
Analyze NetFlow/IPFIX traffic data to identify top talkers, application usage, protocol distribution, and threat flows. Drill into Path Flows for end-to-end latency with hop-by-hop breakdown.
Deep Packet & Socket Analysis
Inspect packet-level data including total packet counts, error rates, throughput (pps), and TCP/UDP/ICMP protocol distribution. Monitor socket connection states across all devices with breakdown by ESTABLISHED, TIME_WAIT, CLOSE_WAIT, LISTEN, and other TCP states.
SLA & Compliance Dashboards
Measure device availability against configurable SLA targets. Track per-device compliance against configuration rules with overall scores, compliant/non-compliant device counts, and per-rule failure details.
Reports & Intelligence
Generate comprehensive reports covering security posture, compliance frameworks, network performance, user activity, incidents, and policy execution. Export as PDF or CSV for stakeholder distribution.
Navigation Structure
Beak NOC organizes its features into the following sections, all accessible from the left sidebar.
Header Controls
The top bar is present on every page:
| Control | Description |
|---|---|
| Tenant selector | Switches the active tenant. Most deployments use a single tenant, shown as Default Tenant |
| Company selector | Scopes every page to one client company, or to All Companies for the whole tenant |
| Help | Opens the Beak NOC documentation page for the screen you are currently viewing |
| Theme toggle | Switches between light and dark appearance |
| User menu | Signed-in account, role, and sign-out |
Monitoring
| Module | Description |
|---|---|
| Dashboard | Real-time NOC overview with KPIs, device status, alert trends, and bandwidth charts |
| Topology | Visual network map showing device nodes and link connections |
| Devices | Complete inventory of all monitored network devices |
| Alerts | Active alerts filtered by severity — Critical, High, Medium, Low |
| Incidents | Incident lifecycle management from New through Closed |
| SLA | Service Level Agreement compliance tracking per device |
| Network Health | Composite network health score with trend analysis |
Security
| Module | Description |
|---|---|
| Security | Security posture scoring, SSL/TLS monitoring, CVE scanning, port exposure, DNS security, and event timeline |
| Compliance | Configuration compliance rules and per-device scoring |
Infrastructure
| Module | Description |
|---|---|
| Discovery | Multi-phase network scanning and credential management |
| WAN Monitoring | Wide Area Network link monitoring — latency, jitter, packet loss, and SLA compliance |
| SD-WAN | SD-WAN tunnel monitoring, health scoring, and latency/loss tracking |
| VLANs | VLAN topology, port distribution, traffic volumes, and 24-hour trends |
| SPAN Sessions | Port mirroring session management for packet capture |
| IPAM | Subnet tracking, IP utilization, and address allocation |
| Config Backup | Automated configuration backup and drift detection |
Traffic & Analysis
| Module | Description |
|---|---|
| Network Flows | NetFlow/IPFIX traffic analysis, top talkers, and path flows |
| Packet Analysis | Deep packet inspection, protocol distribution, and socket analysis |
| Traffic | Per-device traffic monitoring with inbound/outbound trends |
| Bandwidth | Interface utilization monitoring and top consumers |
Wireless
| Module | Description |
|---|---|
| WiFi Monitor & Heat Map | AP health, client distribution, signal analysis, and RF coverage visualisation |
Advanced Tools
| Module | Description |
|---|---|
| PerfStack | Multi-metric timeline correlation for rapid root-cause analysis |
| Dashboard Builder | Custom monitoring dashboards composed from any NOC data source |
| Vendor Dashboard | Device-model-aware monitoring with vendor-specific metrics |
Integrations
| Module | Description |
|---|---|
| Application Monitor | HTTP/HTTPS endpoint monitoring, response time, uptime, and SSL tracking |
| Cloud Monitoring | AWS, Azure, and GCP resource health alongside on-premises monitoring |
Reporting
| Module | Description |
|---|---|
| Reports | Comprehensive intelligence reporting — security, compliance, network, user activity, and incidents |
| Scheduled Reports | Automated recurring report generation and email delivery |
Getting Started
- Run a Discovery Scan — Navigate to Discovery and create a discovery job targeting your network's IP ranges. Start with a Ping Sweep to find all live hosts, then run Full Discovery to enrich each device with SNMP/SSH data.
- Review Discovered Devices — Go to Devices to verify all devices were found and categorized correctly.
- Set Up Credentials — In Discovery → Credentials, add SNMP community strings and SSH/WinRM credentials so Beak NOC can collect detailed metrics from managed devices.
- Monitor the Dashboard — Return to the Dashboard to watch real-time KPIs populate as data collection begins.
- Configure Alerts — Review Alerts to understand the alert severity model and set up incident escalation.
- Enable Config Backup — Visit Config Backup to ensure all critical devices have backup jobs scheduled.
- Review Security Posture — Check the Security page to see your initial security posture score and act on any critical findings.
Documentation
Monitoring
- Dashboard — Real-time NOC overview and KPI metrics
- Topology — Visual network map
- Devices — Network device inventory
- Alerts — Alert management and severity levels
- Incidents — Incident lifecycle management
- SLA — Service Level Agreement monitoring
- Network Health — Health scoring and trends
Security
- Security — Security Operations Center
- Compliance — Configuration compliance
Infrastructure
- Discovery — Network discovery and credential management
- WAN Monitoring — WAN link latency, jitter, packet loss, and SLA compliance
- SD-WAN — SD-WAN tunnel health and management
- VLANs — VLAN topology and traffic analysis
- SPAN Sessions — Port mirroring session management
- IPAM — IP address management and subnet tracking
- Config Backup — Backup and drift detection
Traffic & Analysis
- Network Flows — Flow analysis and path monitoring
- Packet Analysis — Deep packet and socket analysis
- Traffic & Bandwidth — Traffic and bandwidth utilization
Wireless
- WiFi Monitor & Heat Map — Access point health and RF coverage
Advanced Tools
- PerfStack — Multi-metric correlation workspace
- Dashboard Builder — Custom monitoring dashboards
- Vendor Dashboard — Vendor-specific device metrics
Integrations
- Application Monitor — HTTP endpoint and application monitoring
- Cloud Monitoring — AWS, Azure, and GCP resource monitoring
Reporting
- Reports — Intelligence reports, risk scoring, and compliance reporting
- Scheduled Reports — Automated report delivery
System
- System Administration — Tenants, sites, clients, users, and collectors