BEAK SWA — Smart Work Analytics
BEAK SWA (Smart Work Analytics) is an enterprise productivity and well-being intelligence platform that captures real-time work activity from a lightweight desktop agent and turns it into actionable insights at the individual, team, project, department, and organization level. SWA tracks how time is spent across applications, domains, and meetings — separating productive, idle, and unproductive work — and surfaces behaviour patterns, work-life-balance trends, and employee sentiment.
Key Capabilities
Agent-Based Activity Capture
A native Windows agent (v6.0) installs silently on each user's work device and continuously captures application usage, foreground window titles, screen time, idle thresholds, keyboard and mouse pulse, and optional periodic screenshots. The agent is pre-configured per tenant — no manual server URL or API key entry required.
Multi-Level Analytics
Pre-built analytics views span 14 dimensions — from a single user's Self Analytics page up through Team, Project, Department, and Organization Trend rollups. Every view shares a common date and filter bar so the same time window can be compared across dimensions.
Productivity Classification
Every captured application and domain is classified into a productivity category — Browser, Communication, Core Work, Design, Development, Entertainment, Idle, Meeting, Research, Social Media, and custom — with a Productive / Neutral / Unproductive flag, optional target hours, and target %. Time then automatically rolls up as productive, idle, or unproductive.
Behaviour & Mood Insights
Behaviour Analytics surfaces login trends, overtime %, and productive vs non-productive ratios. Mood of the Day (MOD) tracks daily employee sentiment with breakdowns by department, project, and location — so HR and managers can spot stress hotspots before they become attrition.
Shifts & Schedule Awareness
A flexible shift engine resolves the working window for each employee using a precedence chain — HRMS-synced override → project assignment → department assignment → tenant default → built-in fallback (9:00 AM – 6:00 PM IST, Mon–Fri). Overtime and after-hours work are calculated against the resolved shift.
Connectors & Device Mapping
External connectors automatically sync devices to users so the agent doesn't require per-machine login. Out-of-the-box connectors include Microsoft Intune, iPeople HRMS, and CSV Import, with a manual-mapping fallback for any device.
Role-Based Access
A built-in RBAC layer ships with 14 default roles (Executive, CIO, Delivery Head, Department Head, Manager, HR Manager, HR, Auditor, Employee, etc.) and a per-role Menu Permissions editor. A Menu Customization page lets a tenant admin hide or show menu items globally.
Privacy by Design
Input activity captures counts only — keystrokes and clicks are aggregated per hour, never logged as content. Screenshots are configurable (default 20-minute interval) and can be disabled per tenant. Data retention is configurable from 30 to 730 days.
Navigation Structure
BEAK SWA organizes its features into two top-level groups in the left sidebar — ANALYTICS and SETTINGS.
Analytics
| Module | Description |
|---|---|
| Self Analytics | Personal productivity insights for the signed-in user |
| Dashboard | Organization-wide overview with KPI tiles, activity trend, and top performers |
| Team Analytics | Team-level productivity and member roll-up |
| Project Analytics | Time allocation and productivity per project |
| Department Analytics | Department-level productivity comparison |
| Organization Trend | Trend analysis across projects, departments, and time |
| Application Analytics | Application usage and productivity breakdown |
| Screen Time | Per-employee screen time, idle hours, and productive % |
| Behaviour Analytics | Login trends, work-life balance, productive vs non-productive |
| Domain Analytics | Website and domain usage classification |
| Input Activity | Keyboard and mouse pulse — counts only, no keylogging |
| Meeting Analytics | Meeting time vs focused work, breakdown by application |
| Agent Installation | Device fleet status — installed, active, inactive, version |
| Mood of the Day | Daily mood capture with department, project, and location rollups |
Settings
| Module | Description |
|---|---|
| General Settings | Agent download, tenant identity, idle threshold, screenshot interval, retention, SMTP |
| Device Setup | Device fleet — map users, deactivate, block |
| Connectors | Microsoft Intune, iPeople HRMS, CSV import, manual device-user mapping |
| Categories | Application productivity categories with target hours and % |
| Domain Categories | Website domain classification |
| Applications | Tracked application catalog — process name, publisher, category, type |
| Departments | Department directory |
| Projects | Project directory with code, owner, and lifecycle |
| Designations | Job titles |
| Shifts | Shift definitions, assignments, and resolution precedence |
| Roles | RBAC roles and menu permissions |
| Users | User accounts, auth type (SSO/Local), role, department, designation, manager |
| Menu Customization | Tenant-wide control of which menu items are visible |
| Build Your Organisation Structure | One-time 8-step setup checklist for a new tenant — Departments → Designations → Projects → Shifts → Roles → Categories → Users → Device Activation |
Dashboard Snapshot
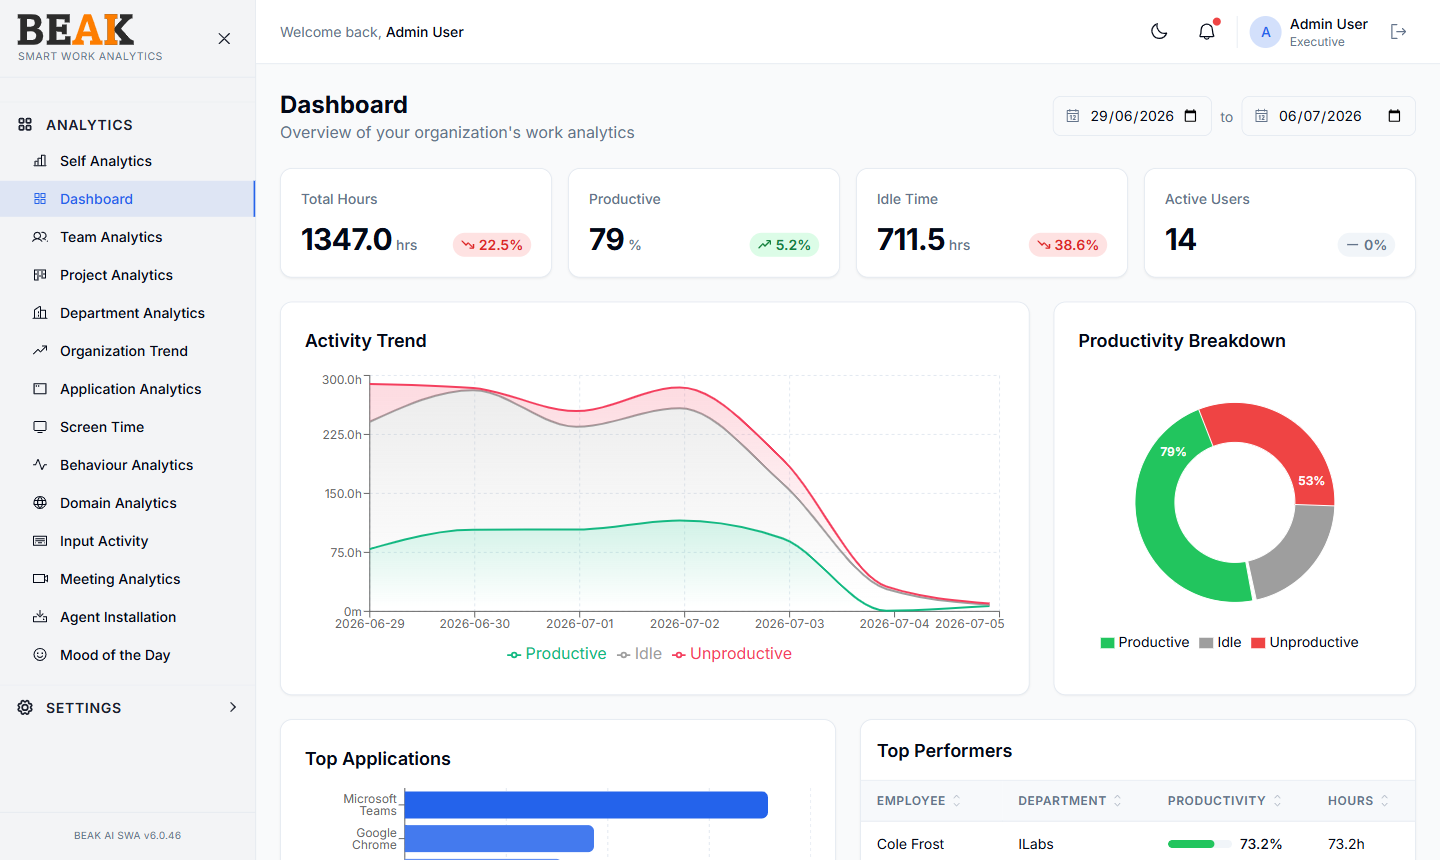
The Dashboard is the organization-wide landing page for executives, delivery heads, and HR managers. It surfaces four KPI tiles — Total Hours, Productive %, Idle Time, and Active Users — alongside an Activity Trend line chart, a Productivity Breakdown donut, Top Applications, and a sortable Top Performers table.
Every chart respects the global date range picker at the top of the page. Comparison values (e.g. ↘ 41.2%) show change vs the previous matching period.
Productivity Model
SWA buckets every minute of captured activity into one of three states:
- Productive — time spent in applications and domains classified as productive (e.g. Core Work, Development, Meeting)
- Idle — time spent at a locked screen or below the idle threshold (default 20 minutes of inactivity)
- Unproductive — time spent in applications and domains classified as unproductive (e.g. Entertainment, Social Media)
Productive % is calculated as Productive Hours / (Productive + Unproductive Hours) — idle is excluded from the denominator so a user is not penalized for stepping away from their desk.
Data Model
SWA correlates activity across these primary entities:
- Devices — registered work computers running the SWA agent
- Users — employees with SSO or local authentication
- Departments — organizational units (e.g.
Engineering,Sales) - Projects — work streams with a code, owner, and lifecycle state
- Designations — job titles (e.g.
Senior Engineer,Project Manager) - Shifts — working windows with break and grace allowances
- Categories — productivity classification for applications and domains
- Roles — RBAC roles with menu-level permission control
Getting Started
Tip: New tenant admins should start with the Build Your Organisation Structure checklist — it walks through all eight steps below in the correct dependency order with direct links to each admin page.
- Configure tenant identity — Set company name, timezone, idle threshold, and retention in General Settings.
- Set up connectors — Connect Microsoft Intune, iPeople HRMS, or upload a CSV so devices map to users automatically.
- Define categories and applications — Review the seeded Categories and Applications, then mark productive vs unproductive for your business.
- Define shifts — Create Shifts for each working pattern and assign them to projects or departments.
- Invite users and assign roles — Add Users, assign Roles, and customize Menu Permissions.
- Deploy the agent — From General Settings →
Agent Download, distribute the pre-configured Windows agent to user devices via Intune or any deployment tool. - Validate device fleet — Watch Agent Installation for new devices to come online; map any unassigned devices in Device Setup.
- Review your first analytics — Once data flows in, start with the Dashboard, then drill into Team, Project, and Application views.
Key Metrics
| Metric | Value |
|---|---|
| Default idle threshold | 20 minutes |
| Default screenshot interval | 20 minutes |
| Data retention range | 30 – 730 days |
| Built-in productivity categories | 12 |
| Default roles | 14 |
| Connector types | 3 (Intune, iPeople HRMS, CSV) |
| Agent platform | Windows (v6.0) |
Documentation
- Self Analytics — Personal productivity view
- Dashboard — Organization overview
- Team Analytics — Team productivity rollup
- Project Analytics — Project time allocation
- Department Analytics — Department comparison
- Organization Trend — Trend analysis
- Application Analytics — Application usage
- Screen Time — Per-employee screen time
- Behaviour Analytics — Login and overtime patterns
- Domain Analytics — Website usage
- Input Activity — Keyboard and mouse pulse
- Meeting Analytics — Meeting vs focus
- Agent Installation — Device fleet status
- Mood of the Day — Employee sentiment
- General Settings — Tenant configuration
- Device Setup — Device management
- Connectors — Intune, iPeople, CSV
- Categories — Productivity categories
- Domain Categories — Domain classification
- Applications — Application catalog
- Departments — Department directory
- Projects — Project directory
- Designations — Job titles
- Shifts — Shift management
- Roles — RBAC roles
- Users — User management
- Menu Customization — Menu visibility
- Build Your Organisation Structure — One-time setup checklist