Logs
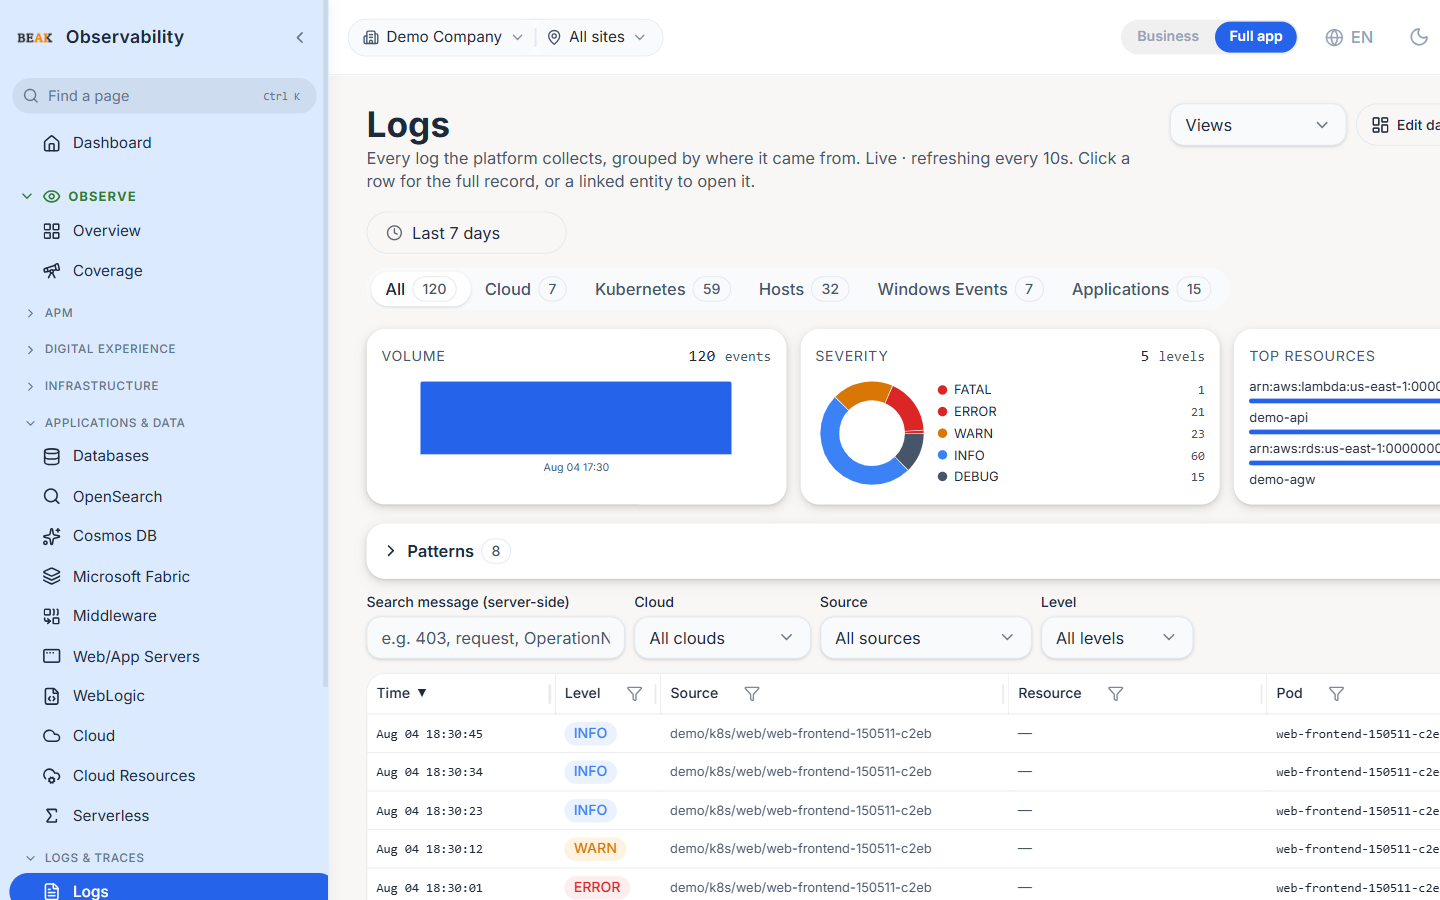
The Logs page is the cross-source log explorer. Every log the platform collects arrives here, grouped into a tab per producing entity rather than one flat list, so looking for a pod's output does not mean scrolling past cloud activity records. Each tab is its own address, filters live in the URL, and any row that names an entity links straight to it.
Tabs
Each tab is a route, so a view can be bookmarked or pasted to a colleague:
| Tab | URL | What it holds |
|---|---|---|
| All | /logs | Every origin, unfiltered |
| Cloud | /logs/cloud | Azure and AWS resource logs — activity records, diagnostic settings, App Insights, Entra, Event Hub streams, CloudWatch Logs, CloudTrail |
| Kubernetes | /logs/kubernetes | Pod and container output from clusters with log ingestion enabled |
| Hosts | /logs/hosts | Host agent lines and collector-tailed files |
| Windows Events | /logs/windows-events | Windows Event Log records, with channel, event ID, provider, category and severity |
| Applications | /logs/applications | Application SDK output over OTLP, correlated to traces |
Every tab carries a count for the selected time window. A tab with no rows in that window shows no count rather than a zero.
Note: A log line belongs to exactly one tab, so the per-tab counts never double-count a row. The
Allcount is measured independently rather than summed, because a future log source could belong to no tab yet and would still appear underAll.
Time Window and Filters
One time range at the top scopes the whole page — the tab counts, the overview strip and the table below. Presets are Last 15 minutes, Last 1 hour, Last 6 hours, Last 24 hours, Last 7 days and Last 30 days, defaulting to Last 1 hour. An absolute From/To range overrides the preset.
Every tab shares these filters:
- Search message (server-side) — Free-text substring match against the log body, run against the full retention rather than the rows already on screen
- Source — The distinct sources that tab has produced. Scoped to the tab, so the Cloud tab never offers a host source
- Level — Severity filter against the stored vocabulary (
FATAL,ERROR,WARN,INFO,DEBUG)
The Cloud and All tabs add:
- Cloud —
AzureorAWS. Read from the provider attribute stamped at ingest, so it is exact rather than inferred from the source name
The Windows Events tab adds:
- Channel — Populated from the channels that actually have records in the window, so every option returns rows
- Severity —
Critical,Error,Warning,Information - Category —
Security,Service,System,Application,Hardware,Other
The Kubernetes tab adds a Cluster selector, defaulting to all clusters so the tab shows output on arrival.
Filters are held in the query string. /logs/cloud?provider=azure&level=ERROR&w=86400 opens the same rows for anyone who receives the link.
Overview Strip
Three widgets sit above the table, each computed server-side over the whole selected window rather than from the rows on screen — so they describe the full population even though the table holds only the most recent matches:
- Volume — Log count per time bucket across the window, with the total alongside. The bucket size adapts to the window, so a wide range stays readable rather than collapsing into a single bar
- Severity — The split across the severity levels actually present, with a count per level. Rows carrying no severity are grouped as
(none), so the widget's total matches the table's - Top resources — The resources producing the most rows in the window, largest first, with a bar showing each one's share
Filtering by Clicking
Values in the table are clickable wherever the filter exists server-side — Level, Cloud, Source, Channel, Severity and Category. Clicking narrows the view; clicking the active value again clears it. The applied value is shown in bold.
The three overview widgets filter the table as well:
- Volume — Clicking a bar narrows the time range to that bucket
- Severity — Clicking a slice or its legend row filters by that level, dimming the levels now excluded
- Top resources — Clicking a resource filters to that resource's logs
Patterns
Near-identical lines are collapsed into one entry, so a fault that repeated four hundred times reads as one finding. Timestamps, UUIDs, hexadecimal values and bare numbers are normalised away when grouping. The panel is labelled Patterns on most tabs and Top recurring errors on the Kubernetes tab.
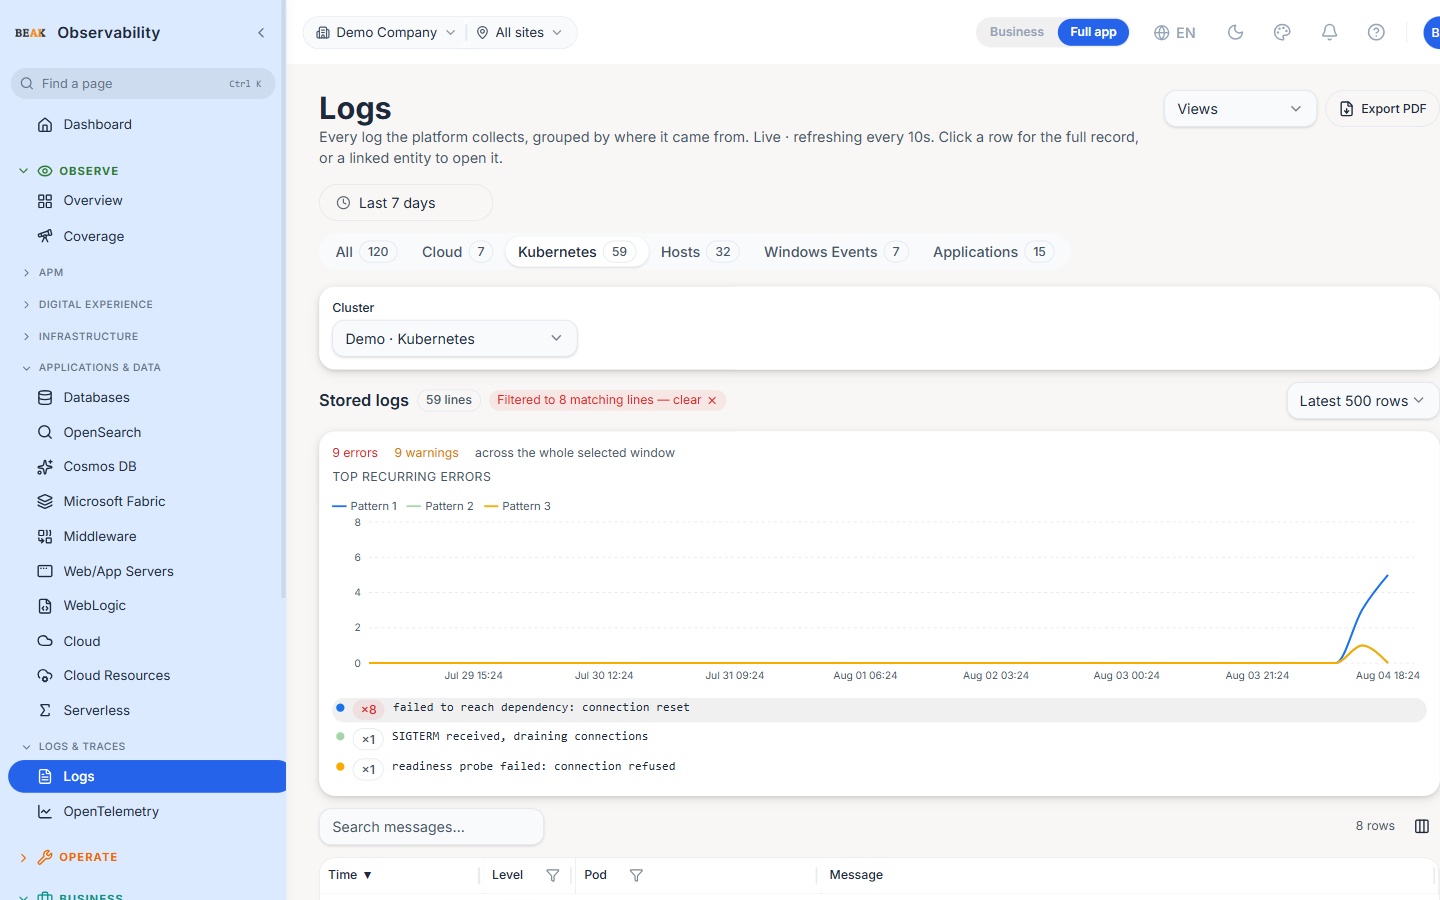
Above the list, a chart plots each of the top patterns over the window. The coloured dot on each row matches its line, which answers the question a count cannot: whether forty errors arrived in a single burst or trickled steadily all day. Clicking a pattern narrows the table to just its occurrences, and the count of matching lines is shown so the narrowing is obvious.
Grouping covers error-like lines — including lines whose text reads as a failure even when their severity does not, such as an INFO line reporting a refused connection. Where an All lines toggle is offered, switching to it groups everything rather than only failures.
Note: Patterns are grouped from the rows currently loaded, not the whole window. The panel states the row count it used.
Drill-Down
Any row that names an entity links to it:
- Resource — Opens that cloud resource on its own
Logstab - Pod — Opens the pod in its cluster
- Host — Opens the host's detail page
- Trace — Opens the distributed trace the line was emitted within
A pod that is no longer in its cluster's synced inventory — most often because it was replaced by a rollout — is shown with a deleted label and is not linked, rather than opening an empty view. The log line itself stays fully readable.
Saved Views
The Views control saves the current tab and its filters under a name and recalls it later. Because the page keeps its state in the URL, a saved view is simply that address plus a label; saved views are local to the browser, and sharing one means sharing the link.
Columns
Each tab carries the columns that identify its own entity. Common to all: Time, Level and Message.
| Tab | Additional columns |
|---|---|
| Cloud | Cloud, Subscription, Resource, Type, Category, and — via the column picker — Workspace, Resource group, Source |
| Kubernetes | Pod, Namespace |
| Hosts | Host, Source |
| Windows Events | Severity, Channel, Event ID, Category, Host, and Provider via the column picker |
| Applications | Source, Trace |
Azure identifiers are resolved to readable names — subscription and workspace GUIDs appear only in the tooltip. AWS resources show the resource name, with the full ARN in the tooltip.
Export
Each tab exports independently:
- CSV / XLSX — The table's own Export menu. The export re-queries at a higher row ceiling, so the file is the full result set for the current filters rather than the page on screen
- PDF — Captures the tab as displayed, including its filters and overview strip
Drawer
Clicking a row opens a side drawer with the complete record — every resource attribute, every log attribute, the structured body if the line had one, and the resolved facts. Use it for one-off field inspection; for anything repeated, the Patterns panel is the better surface.
Best Practices
- Narrow the time window before adding filters — a tight window returns fast queries even at high ingest rates, and the tab counts tell you where the volume is before you open a tab.
- If a tab shows no rows but you expect some, widen the time range first. The counts are window-scoped, so a source that stopped shipping an hour ago reads as empty at
Last 1 hour. - Open
Patternsbefore scrolling. A single repeated fault is far easier to see as one grouped entry than as four hundred consecutive rows. - Filter by clicking values in the table rather than hunting for the matching dropdown — it is the fastest way to narrow an investigation, and every click is reversible.
- Save a view for the searches you repeat, and paste the URL when handing an investigation to someone else.
Related Pages
- Kubernetes — Cluster inventory, pod detail and per-cluster log ingestion
- Cloud — Cloud integrations that produce the Cloud tab's logs
- Tracing — Trace context that pairs with log lines via trace and span IDs
- Alerts — Rules that key off log volume, severity and message patterns