Monitors
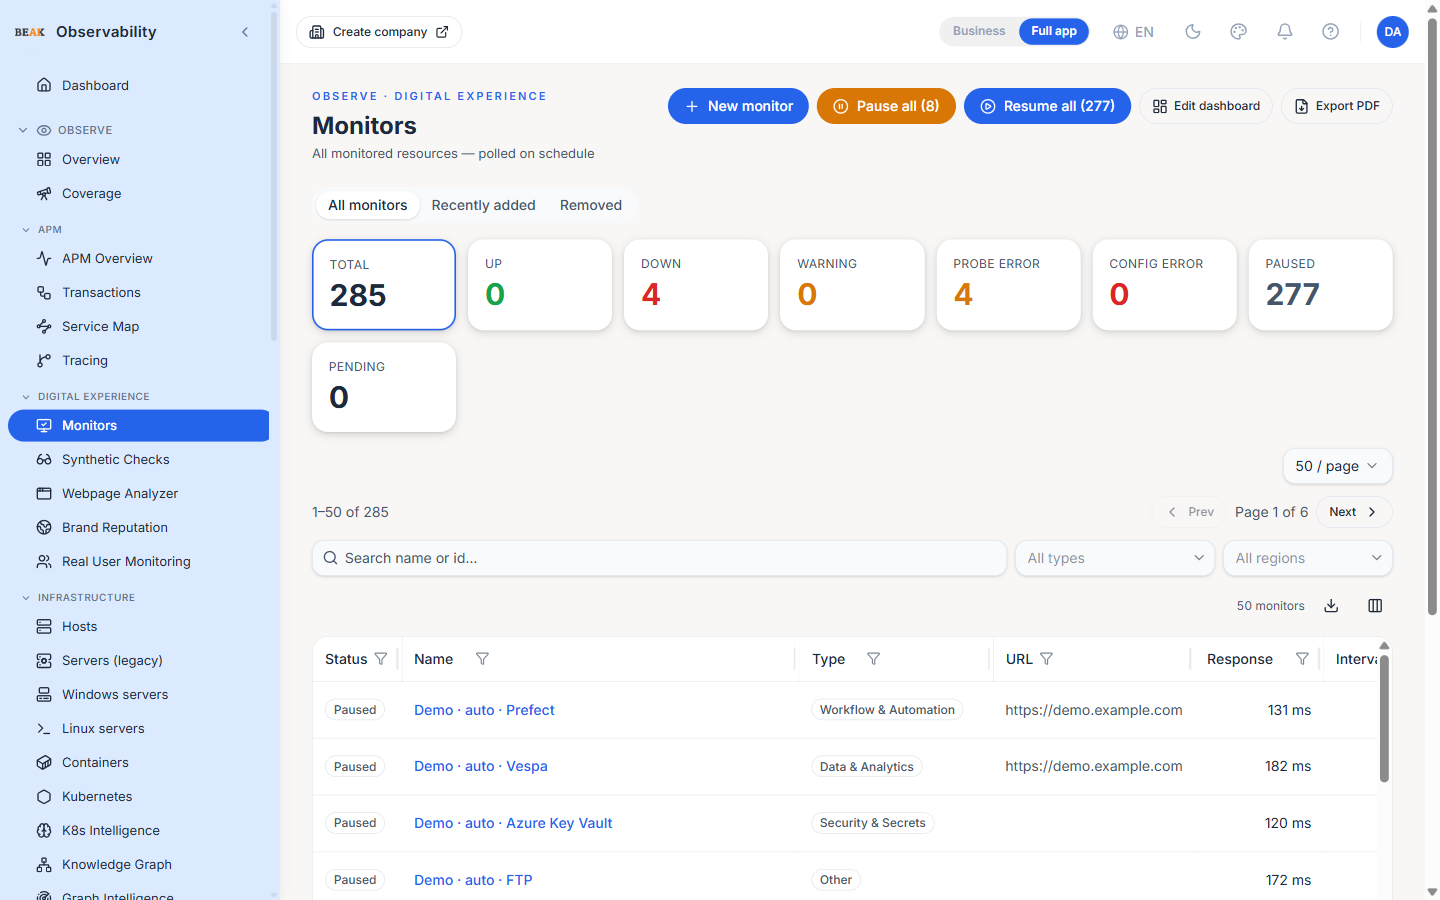
The Monitors page sits under the OBSERVE · DIGITAL EXPERIENCE eyebrow with the lead "All monitored resources — polled on schedule". It lists every synthetic check the tenant runs against external endpoints — HTTP, TCP, ping, DNS, SSL, JSON assertion, gRPC health, WHOIS, and the rest of the catalog. The table is server-paginated and survives at twenty-thousand-monitor scale; URL parameters drive filter and sort state so any view is bookmarkable.
Views
Three tabs switch what the table shows. Each carries a short description so it's clear what you're looking at:
- All monitors — Every monitor in the tenant (the default).
- Recently added — Monitors added since the last time we checked your cloud accounts for changes; a quick way to see what's new.
- Removed — Monitors we stopped watching because the cloud resource behind them no longer exists. They're kept here so you have a record.
Both the Recently added and Removed tabs show a per-day timeline you can click to filter the table to a single day, and their own empty-state text when there's nothing to show.
Hero Strip
A status hero strip above the table summarises the tenant in eight tiles:
- TOTAL — Every monitor in the tenant
- UP / DOWN / WARNING / PROBE ERROR / CONFIG ERROR / PAUSED / PENDING — One tile per derived status
Each tile is clickable and pre-filters the table to that status.
Status by Monitor Type
Below the hero strip, the Status by monitor type card breaks monitor health down by resource category rather than by raw type code. Each horizontal bar is one functional category — Virtual Machine, Database, Storage, Container Service, Networking, Availability Check, and so on — aggregated across cloud providers, so azure_vm and aws_ec2 both roll up under Virtual Machine. Each bar is split into up / warn / error / down segments.
A one-line description under the title explains the view. Clicking a bar filters the table below to that whole category; clicking a specific status segment filters by that category and status together.
Note: The category is a friendly display layer only. Filtering, sorting and the URL parameters still use the underlying type codes, so shared and bookmarked views keep working unchanged.
Status Vocabulary
Every monitor row carries a derived status that drives the table chip and the on-call notifications:
up— Last probe ran successfully and the catalog's default rule did not flag the targetdown— Probe ran, but a catalog-driven default rule fired against an unhealthy target — the only state that is expected to page on-callwarn— Probe ran but the target had partial or no data; review the configurationprobe_error— Probe pipeline failed (auth, throttle, transient network); usually self-healsconfig_error— The target's configuration is broken; needs operator actionpaused— The operator paused the monitor; the scheduler skips itpending— The scheduler has not picked the monitor up yet
Note: The split between
down,warn,probe_errorandconfig_erroris intentional. Treating any non-upvalue as an outage produced noisy pager alerts; reservedownfor the actual outage signal.
Filters
Every column with a filter funnel can be combined. Filter chips are stored in the URL so a triaged view can be shared in a chat or bookmarked.
- Status — Multi-select chips across the seven status values
- Type — Pick a type by its friendly name (category and product, e.g.
Virtual Machine · Amazon EC2); the active chips display the friendly label - Cloud tenant — Narrow to the monitors discovered from one cloud integration (an Azure subscription, an AWS account, and so on); shown only when the tenant has cloud integrations connected. The options and the values a filter offers are scoped to the company you have selected
- Name — Server-side
ILIKEsubstring match on the monitor name
When any filter is active the table fetches a wider page (up to 500 rows) so every match is on one screen; an inline banner appears if the match count exceeds the cap.
Columns
The default column set is:
| Column | Description |
|---|---|
| Status | Derived status chip (UP / DOWN / WARN / etc.) |
| Name | Monitor display name; clicking opens the monitor detail view |
| Type | Friendly resource category (Virtual Machine, Database, Storage, …); hover the chip to see the exact type code and a plain-language description |
| URL | Target URL or endpoint |
| Response | Most recent response time |
| Interval | Probe interval in seconds |
| Last check | Relative time since the last probe |
| Created | Relative time since the monitor was created |
The page-size selector (50 / page by default) is in the toolbar alongside the pagination controls.
Bulk Actions
The Pause all and Resume all actions in the toolbar operate on the rows currently visible after filters. The button label shows the count being affected — e.g. Pause all (12). Use these when an upstream maintenance window is in effect — pause everything pointing at the affected target, then resume after the window closes.
Creating a Monitor
The New monitor button opens a two-step dialog:
- Pick the catalog type (HTTP, TCP, ping, DNS, SSL, JSON, gRPC, WHOIS, regex, etc.).
- Fill in the type-specific fields and the schedule (interval, timeout, retry policy).
Newly created monitors enter the pending state until the next scheduler tick.
Best Practices
- Treat
downas the only paging signal — wirewarn,probe_errorandconfig_errorto a low-noise channel so triage stays clean. - Use the
?status=downURL filter in your incident-response runbook so responders open the same scoped view every time. - Pause non-essential monitors during planned maintenance windows rather than deleting them — the schedule and history survive the pause.
- Combine
Synthetic Checks(the AppManager surface) with this page when comparing catalog coverage against active runs.
Related Pages
- Alerts — Rule definitions that fire on top of monitor status changes
- Incidents — Cases opened when a
downmonitor triggers a rule - AppManager Catalog — Cross-feature coverage map