Knowledge Graph
The Knowledge Graph page is a single canvas across every observability layer — Kubernetes topology, OpenTelemetry-derived services, alerts, incidents, and cloud resources. The graph is laid out with a force-directed fcose algorithm so related nodes cluster together.
Tabs
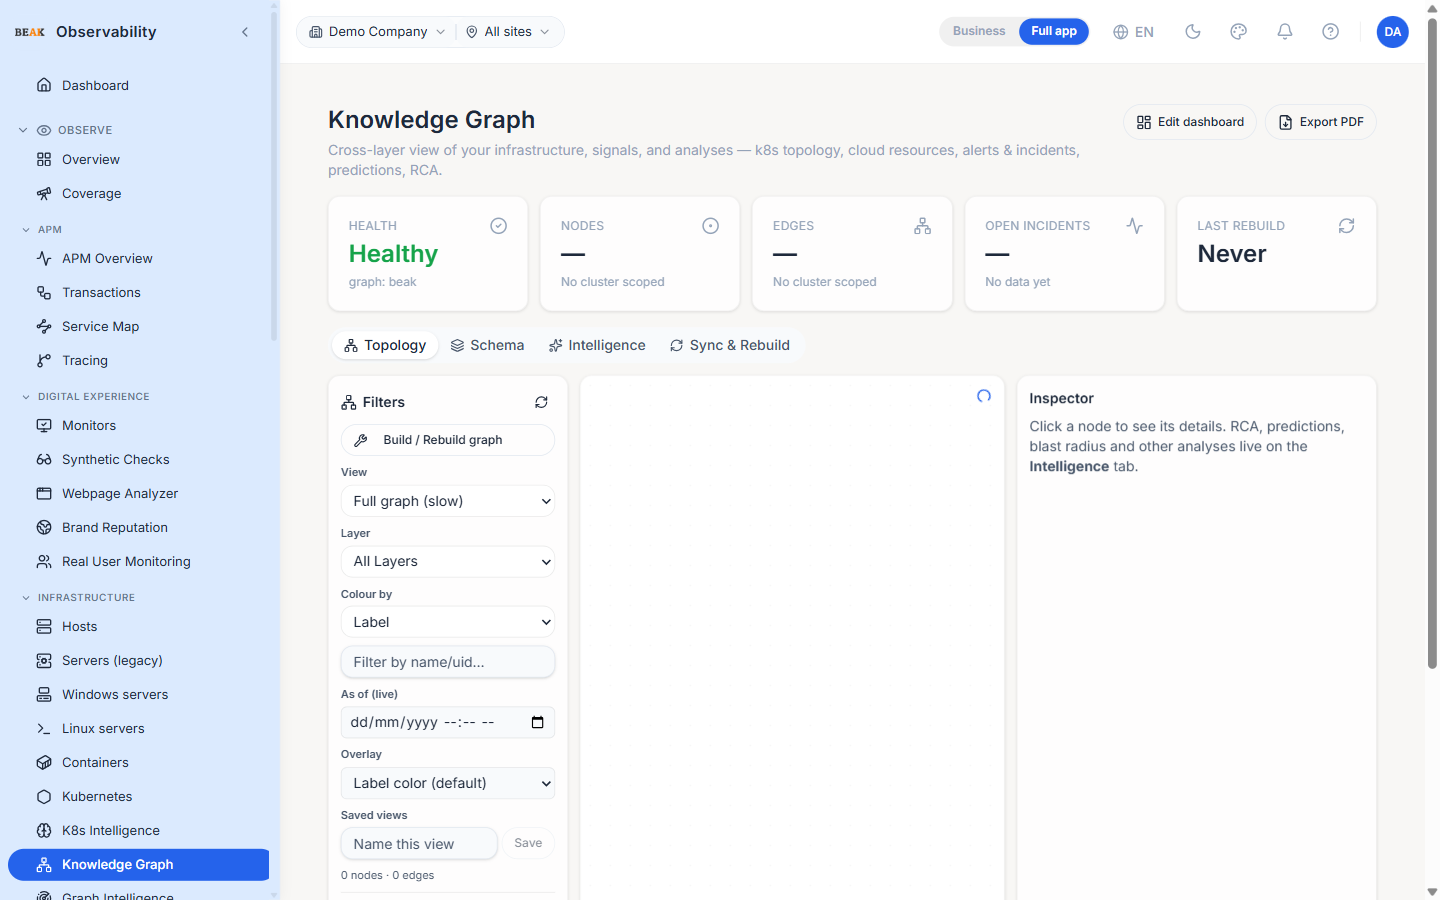
The header carries four tabs and five summary tiles — Health, Nodes, Edges, Open incidents and Last rebuild:
- Topology — The interactive graph canvas (described below)
- Schema — Node labels and edge kinds with live counts
- Intelligence — Graph-powered analyses (RCA, predicted failures, blast radius, single point of failure, cost, drift, SLO burn)
- Sync & Rebuild — Rebuild controls and graph diagnostics
Layout
The page is split into three columns:
- Left —
Filtersheader with node-type chips, aBuild / Rebuild graphaction and a breakdown of node counts per type - Centre — The graph canvas with a running
N nodes · M edgescounter at the top - Right —
Inspectorpanel; the placeholder reads "Click a node to see its details. RCA, predictions, blast radius and other analyses live on the Intelligence tab."
The canvas supports pan and zoom; double-click a node to centre and focus.
Filter Chips
The filter chips on the left toggle visibility per node type. Hide the layers you're not investigating to declutter the canvas — e.g. hide Cloud Resource while debugging an APM trace path.
Intelligence Actions
The right-hand inspector exposes three actions, each gated to the right node type:
- Run RCA — Available on Incident nodes; sends the incident to the platform's RCA engine and renders the suggested probable causes inline
- Predict downstream — Available on any node; walks the graph from the selected node and lists the workloads likely to be impacted if the node degrades
- Find similar — Available on Incident nodes; searches past incidents and solutions for matches to the selected incident
The actions reuse the same backend services as the K8s Intelligence and Incidents pages, so the answers stay consistent across surfaces.
Schema
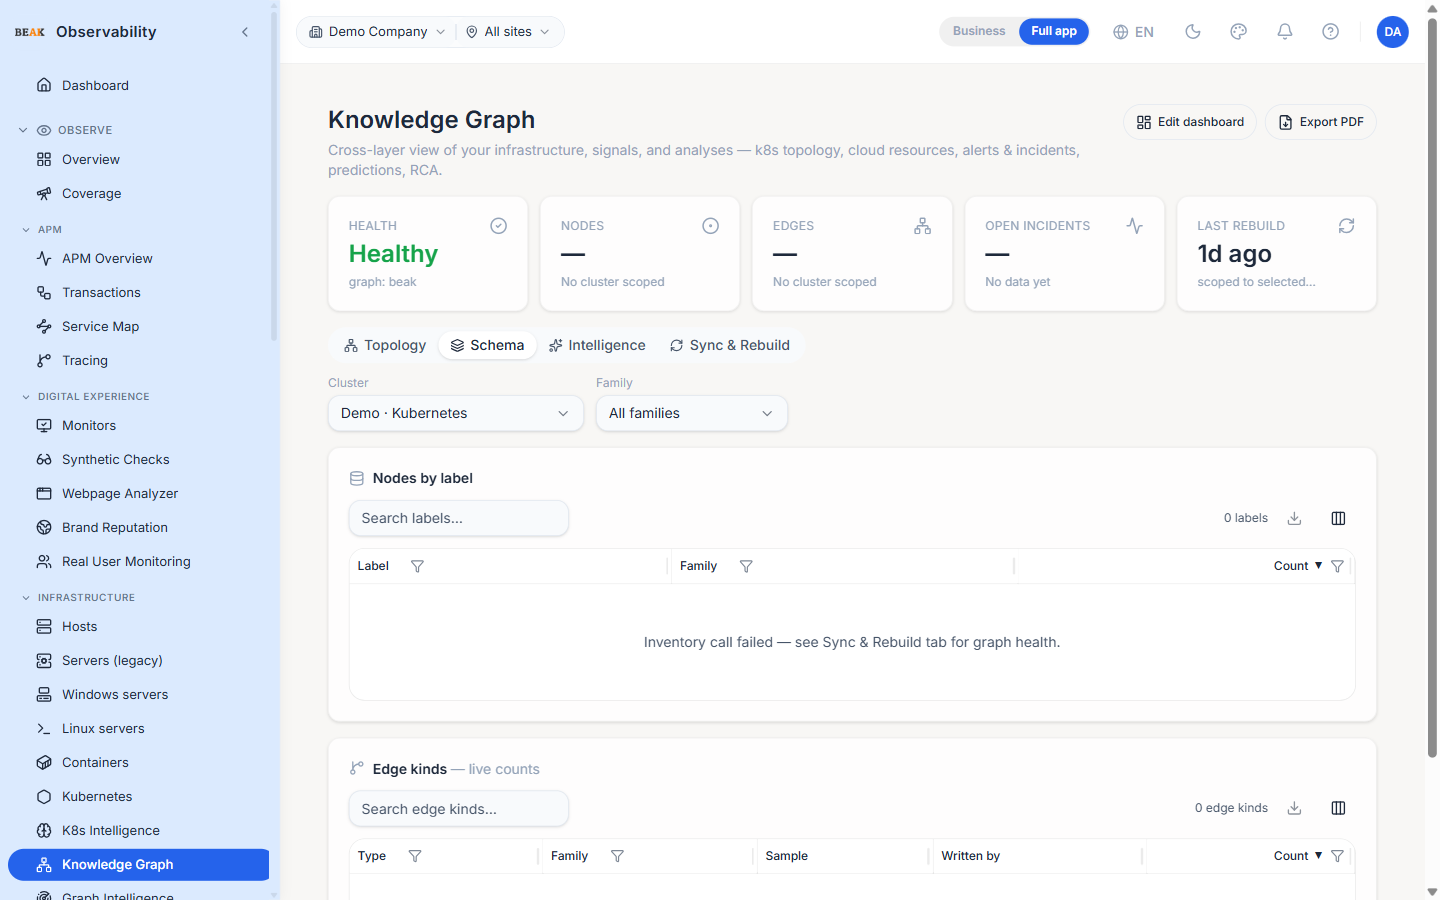
The Schema tab is the graph's data dictionary for the selected cluster. Nodes by label lists every node label with its family and live count; Edge kinds lists every relationship type with a sample and the writer that produced it. Use it to confirm a sync populated the labels you expect.
Intelligence Tab
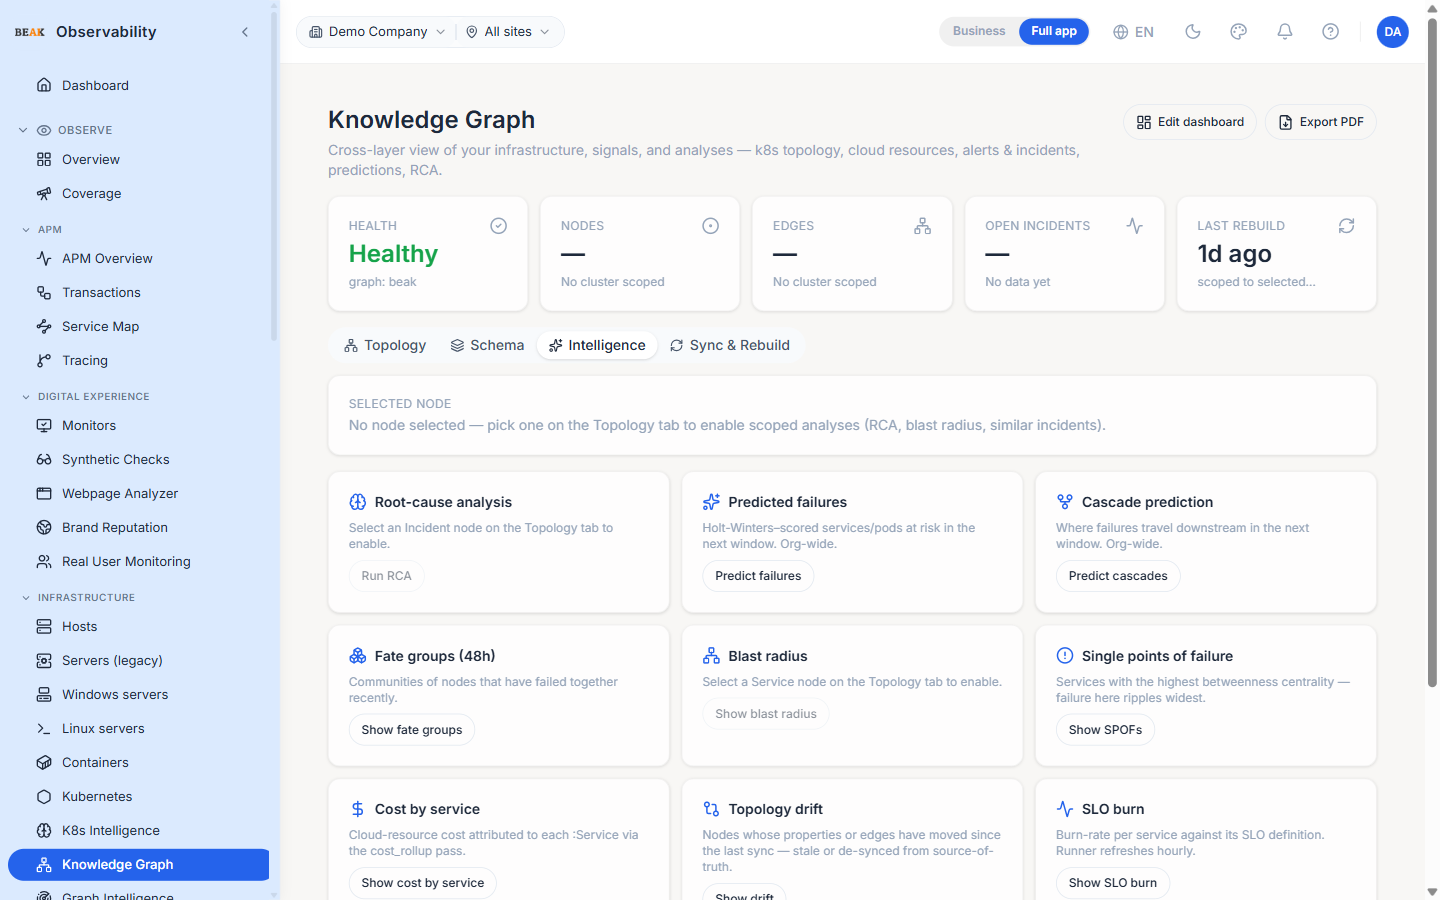
The Intelligence tab is a grid of graph-powered analyses you can launch against the current graph — root cause analysis, predicted failures, cascade prediction, blast radius, single point of failure, cost by service, topology drift and SLO burn. Each card opens the matching analysis.
Sync & Rebuild
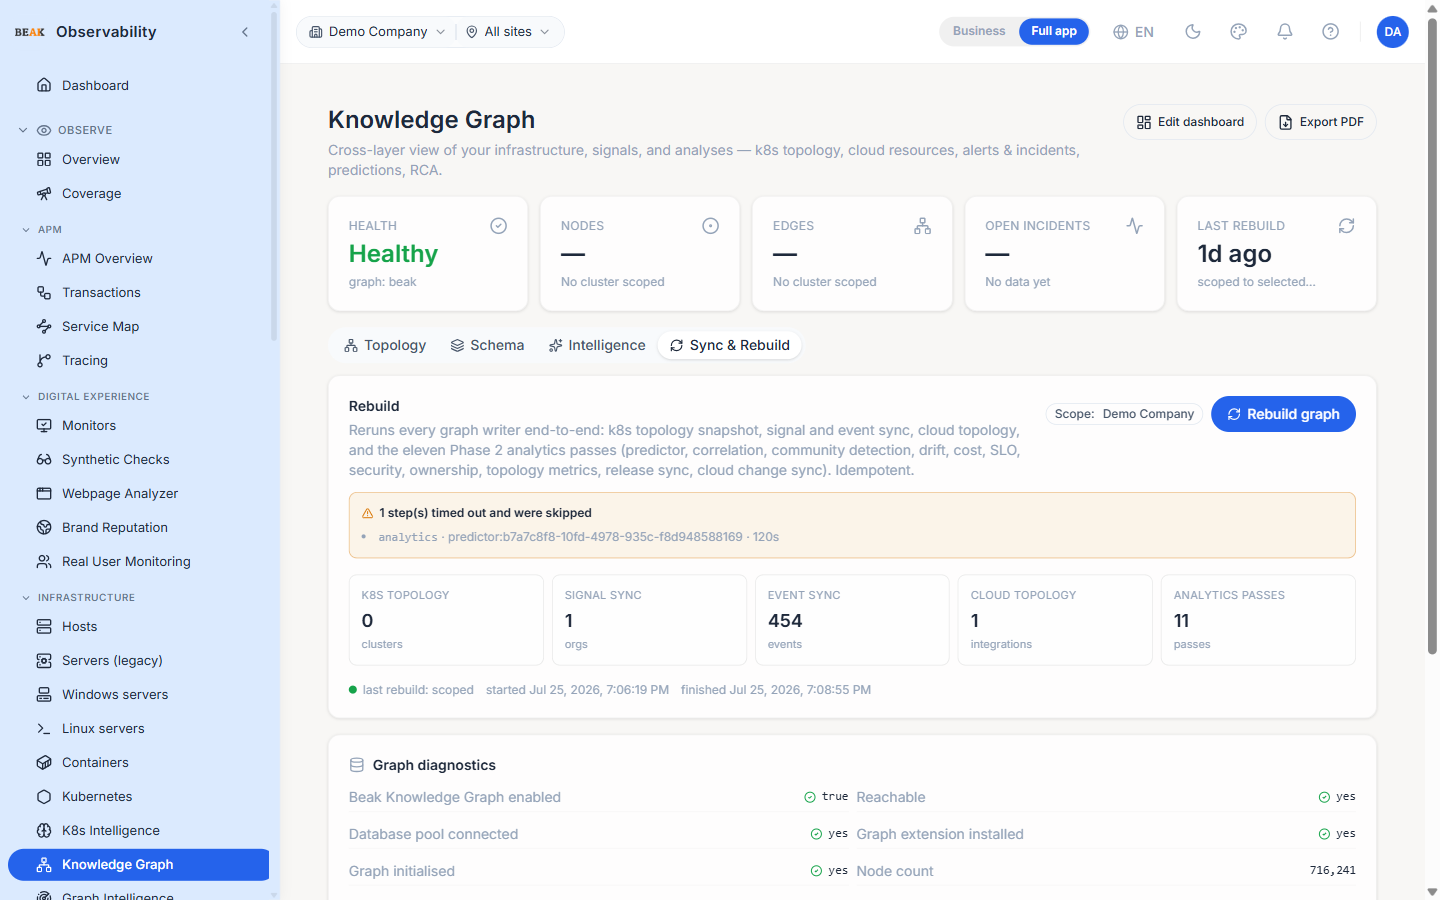
The Sync & Rebuild tab reruns every graph writer end-to-end — Kubernetes topology snapshot, signal and event sync, cloud topology, and the Phase 2 analytics passes — via a Rebuild graph action (the operation is idempotent). Counters track the last run across K8s topology, signal sync, event sync, cloud topology and analytics passes, and a Graph diagnostics panel reports whether the graph is enabled, the database pool is connected, the graph is initialised and live sync is on.
Best Practices
- Start with the layer filters off (everything visible) for an unfamiliar cluster, then narrow as the canvas becomes too dense to read.
- Use
Find similaron a new incident before paging an SME — the platform often has a past resolution that applies. Predict downstreamis the right action for change-management planning — pick the node you're about to touch and read the impact list.- The canvas does not auto-refresh on every change; click
Refresh(top right) to re-fetch after a known topology change.
Related Pages
- K8s Intelligence — Operationally-oriented view over the same graph
- Incidents — Incident feed where RCA actions originate
- Tracing — Service-level data that feeds the OTel layer of the graph