AppManager
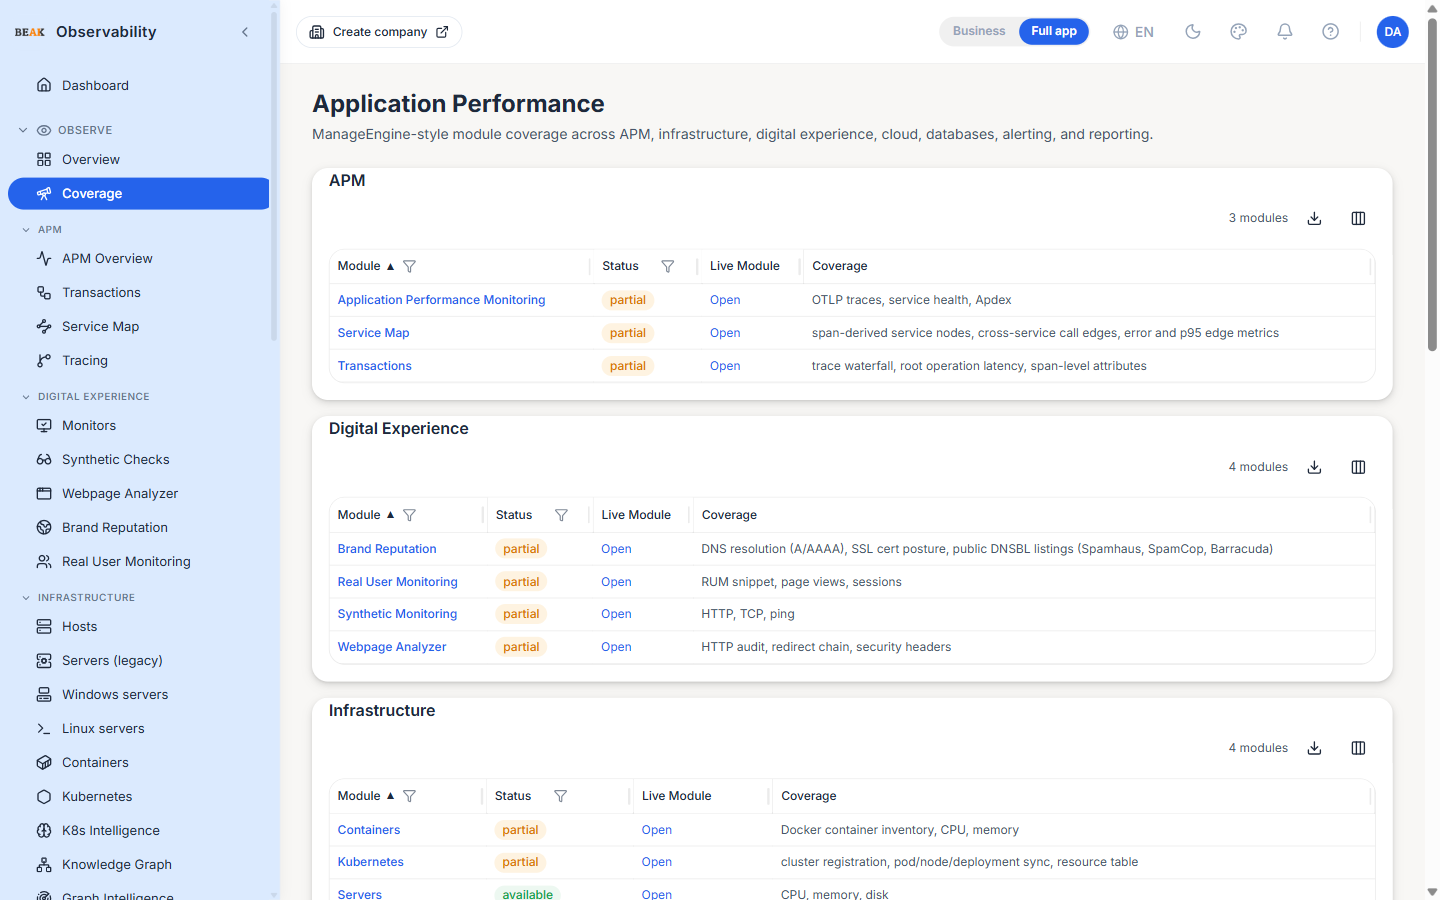
The AppManager surface is the platform's application-monitoring catalog. The landing view (route /appmanager) is rendered with the heading Application Performance and the lead "ManageEngine-style module coverage across APM, infrastructure, digital experience, cloud, databases, alerting, and reporting." It groups every module into a table per domain so the operator can scan coverage at a glance.
Module Tables
Each domain renders one table with four columns:
| Column | Description |
|---|---|
| Module | The module name |
| Status | available, partial or planned |
| Live Module | Open action that deep-links into the matching operational surface |
| Coverage | One-line summary of what the module covers today |
APM
- Application Performance Monitoring — OTLP traces, service health, Apdex; the
Openaction takes the operator to Tracing - Transactions — Trace waterfall, root operation latency, span-level attributes
- Service Map — Span-derived service nodes, cross-service call edges, error and p95 edge metrics
Digital Experience
- Synthetic Monitoring — HTTP, TCP, ping
- Webpage Analyzer — HTTP audit, redirect chain, security headers
- Brand Reputation — DNS resolution (A / AAAA), SSL cert posture, public DNSBL listings (Spamhaus, SpamCop, Barracuda)
- Real User Monitoring — RUM snippet, page views, sessions; the
Openaction takes the operator to RUM
Infrastructure
- Servers — CPU, memory, disk; the
Openaction takes the operator to Hosts - Containers — Docker container inventory, CPU, memory; the
Openaction takes the operator to Containers - Kubernetes — Cluster registration, pod / node / deployment sync, resource table; the
Openaction takes the operator to Kubernetes - Virtualization — VMware and Hyper-V catalog entries, split across
Discovered in cloudandConfigured monitors
Database
- Databases — PostgreSQL, MySQL, MongoDB; the
Openaction takes the operator to Databases
Application Infrastructure
- Middleware — RabbitMQ, Kafka, ActiveMQ, split across
Discovered in cloudandDiscovered on hosts - Web Servers and App Servers — Nginx, Apache httpd, Tomcat
Cloud
- Cloud — AWS, Azure, GCP resource integration shell; the
Openaction takes the operator to Cloud - Serverless — Module placeholder
Observability
- Logs — Log ingest, OTLP logs endpoint, search; the
Openaction takes the operator to Logs - OpenTelemetry — OTLP JSON traces, OTLP JSON metrics, OTLP JSON logs
Operations
- Alerts and Escalations — Rules, incidents, channels; the
Openaction takes the operator to Alerts - Insights & Forecasts — Anomaly detection and forecasting on monitor checks; tabs for
Now anomalous,Forecast,ExpiringandHistory(formerly "Anomaly Detection and RCA") - SLA Management — Per-monitor uptime, configurable target, configurable window (24 h / 7 d / 30 d)
- Reports — Scheduled reports, report runs, notification delivery; the
Openaction takes the operator to Reports - Custom Dashboards — Dashboard CRUD, widget library (uptime, response time, host metric, KPI), monitor + host data sources
System
- Enterprise Administration — Tenancy, companies, sites; the
Openaction takes the operator to Administration
Status Vocabulary
Every row carries a status badge:
available— The module ships and is generally usablepartial— The module ships in a partial form; theModule Coveragecell lists what's working todayplanned— The module is a placeholder in the catalog
Module surfaces
Each catalog row's Open action deep-links into that module's operational surface.
Discovery-backed surfaces
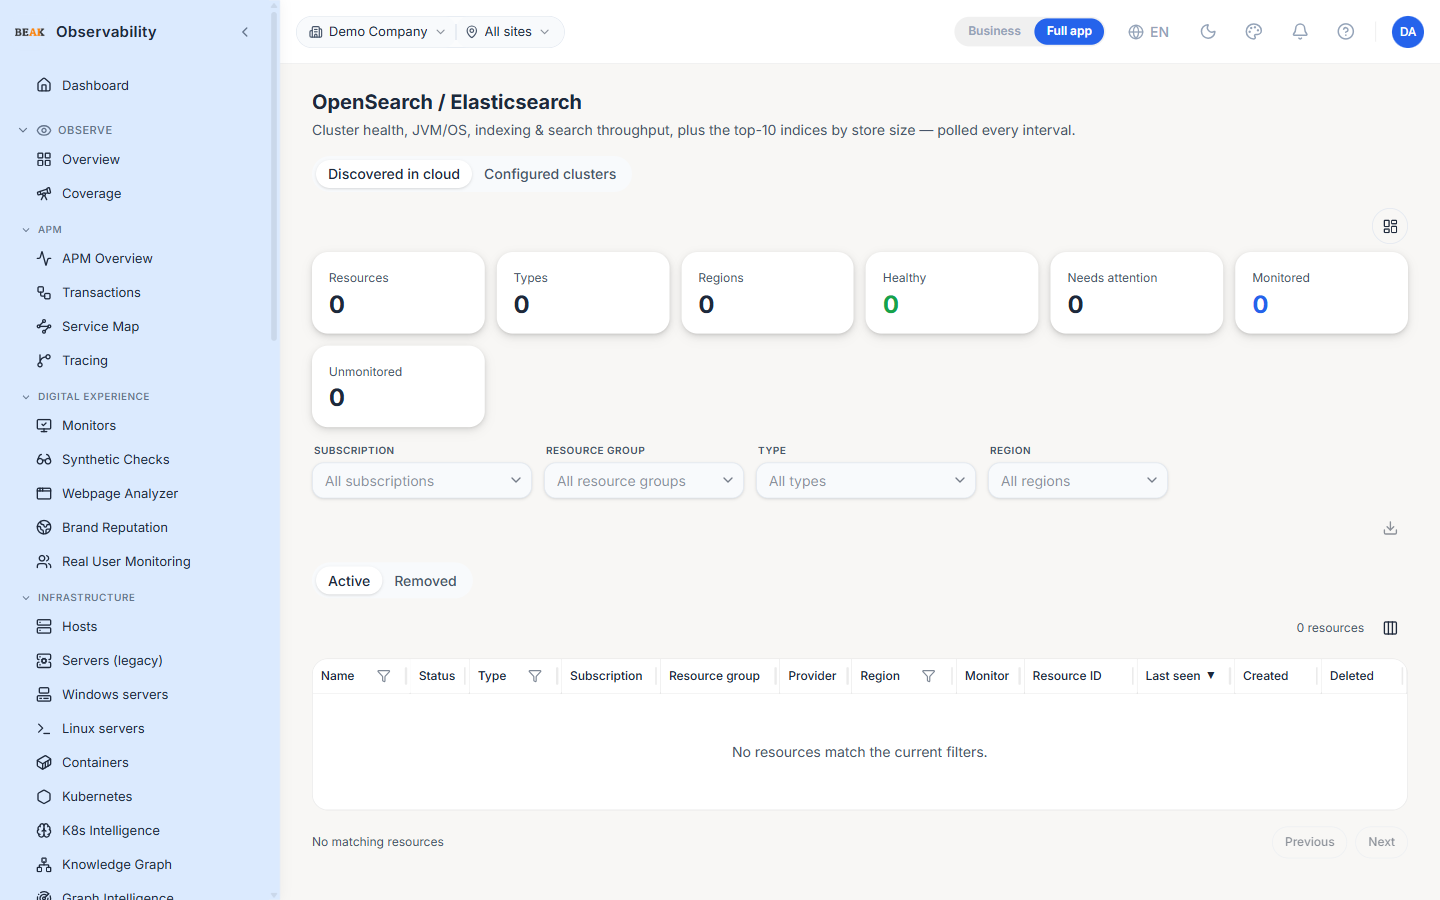
The technology surfaces — databases, OpenSearch / Elasticsearch, Cosmos DB, virtualization, serverless and middleware — share a common layout: a Discovered in cloud / Configured tab split, headline counters (resources, types, regions, healthy, needs-attention, monitored, unmonitored) and a filterable resource table. The Discovered in cloud tab lists resources the cloud integrations found automatically; the Configured tab lists the ones you've explicitly put under monitoring.
Insights & Forecasts (Anomaly & RCA)
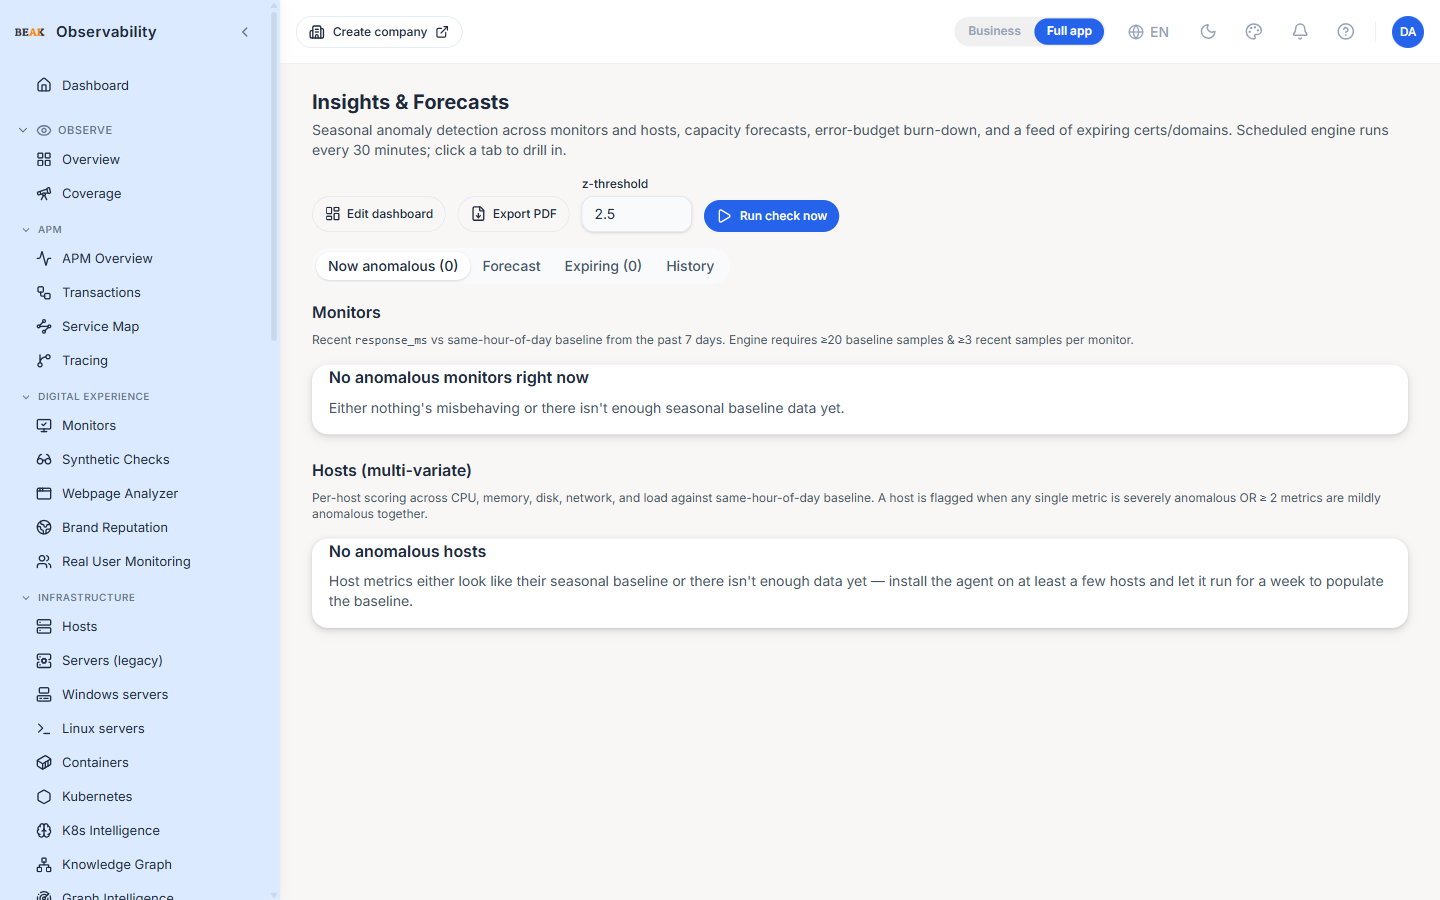
Reached from Operate → Anomaly & RCA, this surface runs seasonal anomaly detection and forecasting across the fleet. The engine is scheduled every 30 minutes, and Run check now triggers it on demand against a configurable z-threshold. Two detectors feed it:
- Monitors — Compares each monitor's recent
response_msagainst a same-hour-of-day baseline from the previous 7 days; a monitor needs at least 20 baseline samples and 3 recent samples to be scored. - Hosts (multi-variate) — Scores every host across CPU, memory, disk, network and load against the same-hour-of-day baseline, flagging a host when any single metric is severely anomalous or when two or more metrics are mildly anomalous together.
Four tabs organise the output — Now anomalous (what's misbehaving right now), Forecast (capacity forecasts and error-budget burn-down), Expiring (a feed of expiring certificates and domains) and History (past detections).
SLA
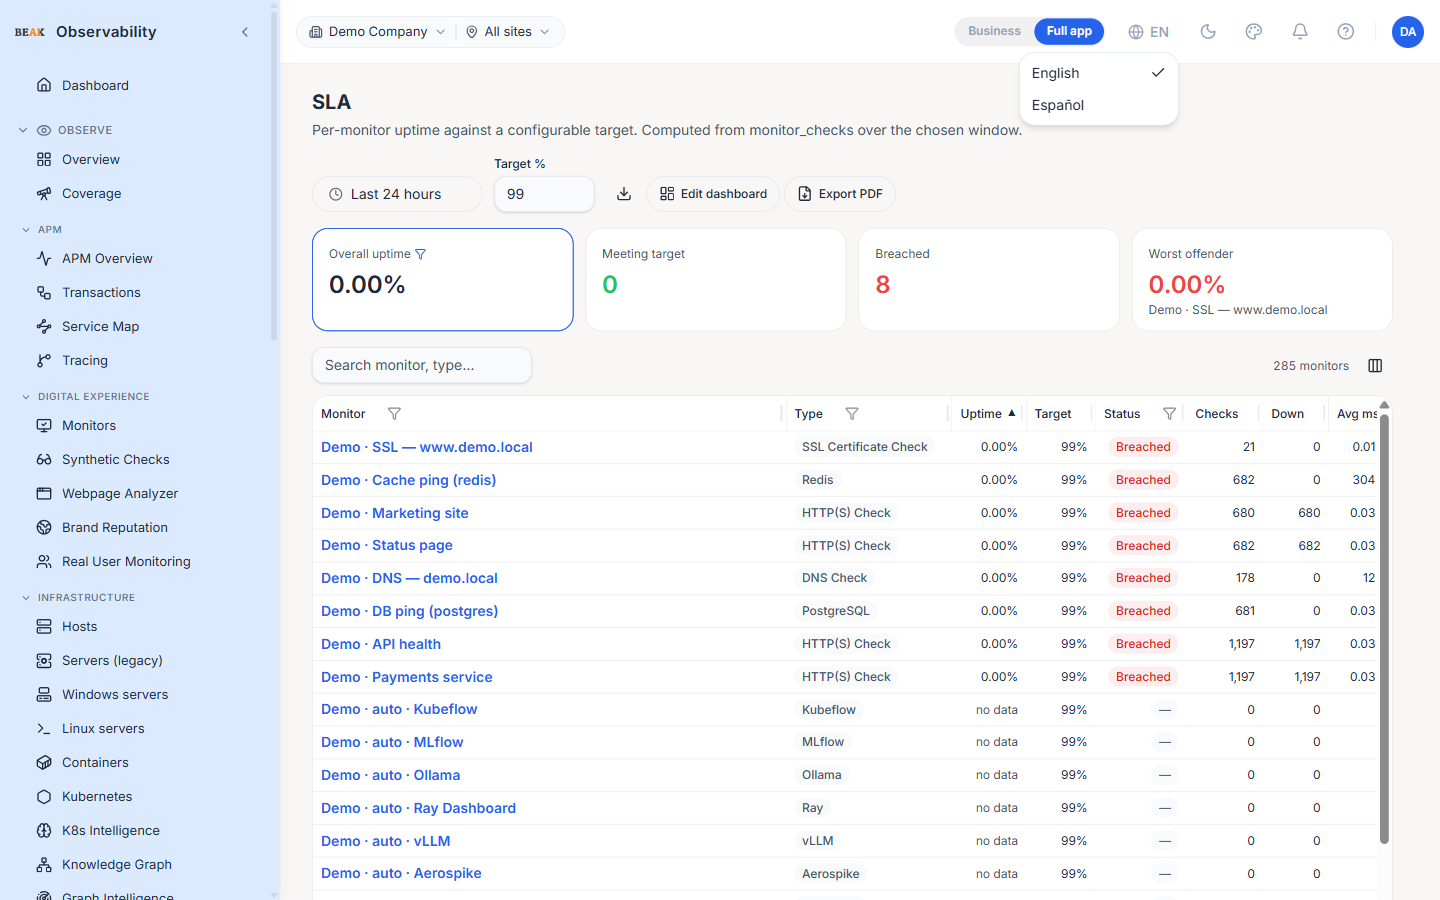
Reached from Operate → SLA, this surface computes per-monitor uptime from monitor_checks over a selectable window (last 24 h / 7 d / 30 d) against a configurable target percentage (e.g. 99%). Each monitor shows its achieved uptime against the target, so you can see at a glance which ones are meeting their availability commitment.
Best Practices
- Use Coverage as the orientation surface for new tenants and new on-call engineers — it answers "what surfaces does this platform have" in one screen.
- Bookmark the per-feature module URL (e.g.
/appmanager/apm) when documenting team runbooks; the module page is more focused than the global Coverage view. - The
Open moduleaction takes the user into the operational page — use it when triaging, not for orientation. - Compare Coverage against your team's monitoring SOP; the gap between the two is where the next quarter's onboarding work usually lives.
Related Pages
- Tracing — APM operational surface
- Monitors — Synthetic check operational surface
- Hosts — Server / infrastructure operational surface
- Kubernetes — Kubernetes operational surface
- Databases — Database operational surface
- Cloud — Cloud operational surface
- Logs — Log explorer
- Alerts — Alert rules and channels
- Administration — Enterprise administration