Cloud Types Reference
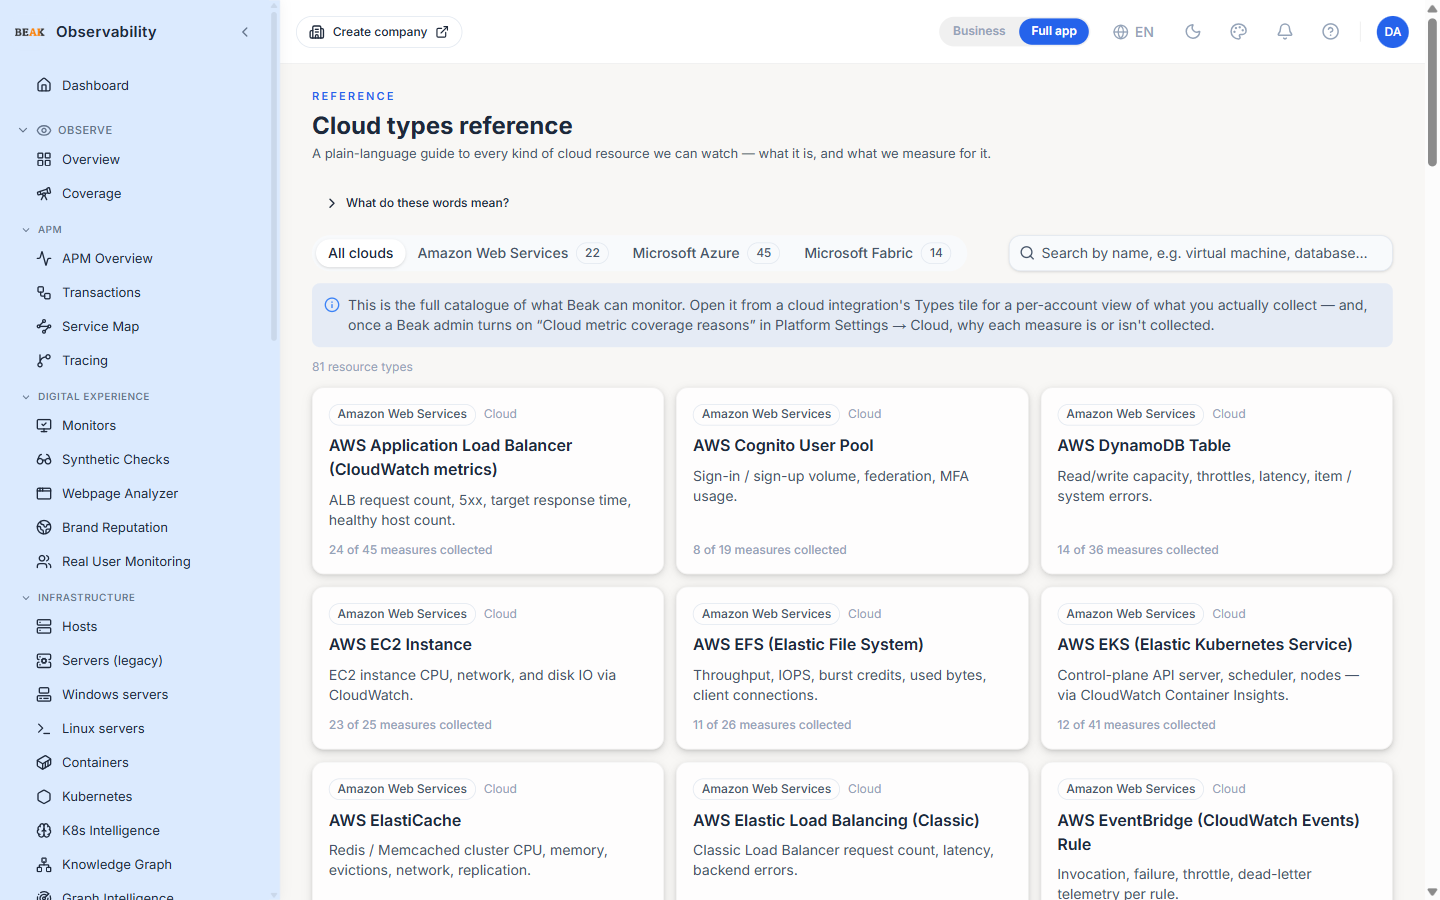
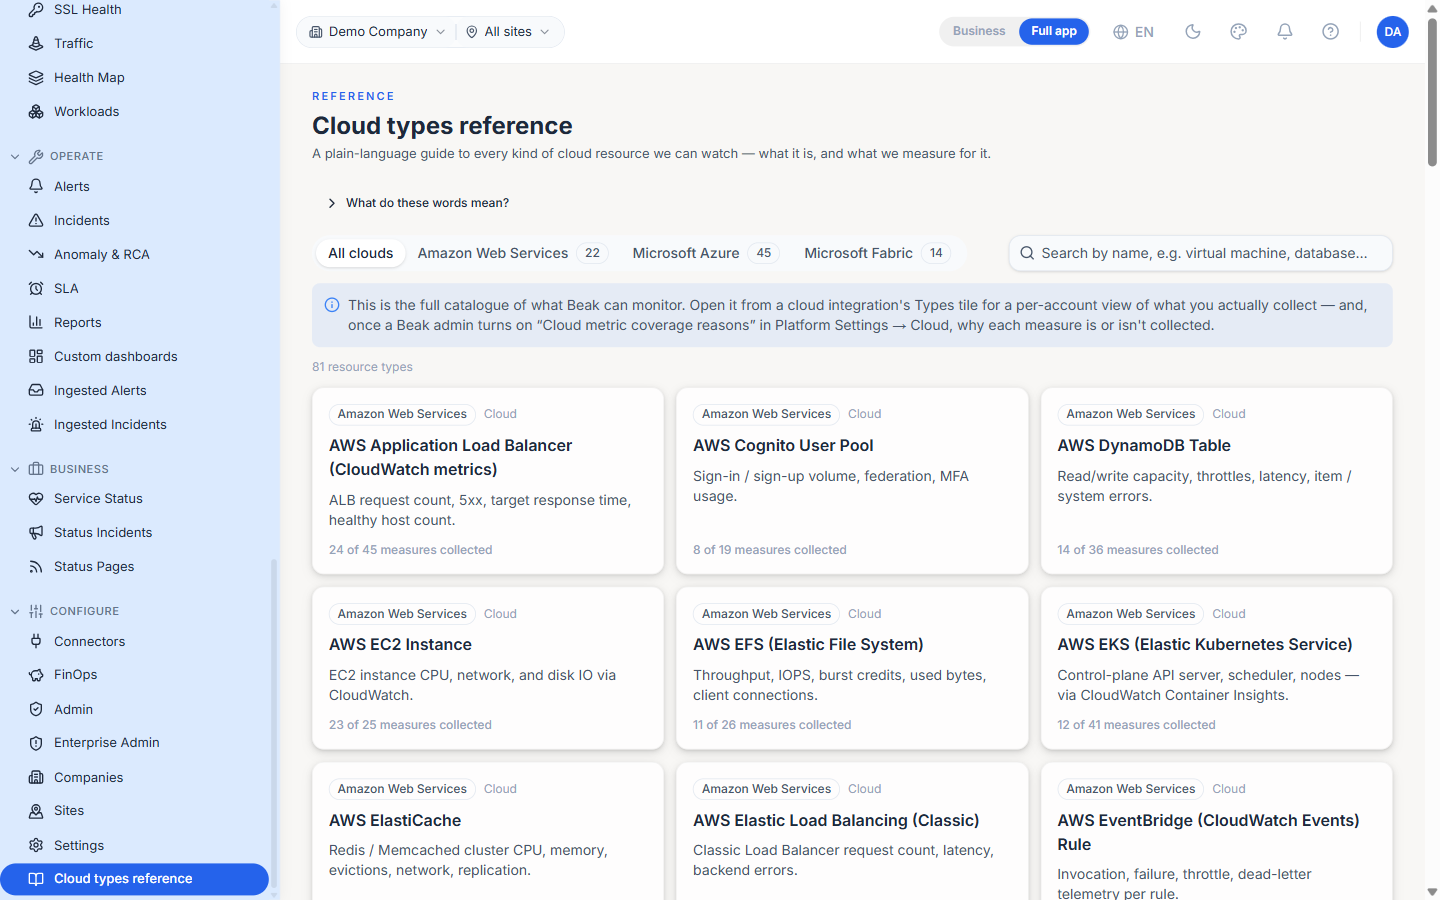
The Cloud types reference page is a plain-language catalogue of every kind of cloud resource Beak can watch — what each type is, and what we measure for it. It lives under Reference → Cloud types reference (/cloud-types) and is written for readers who don't live in the monitoring internals: there are no raw metric keys or status codes, just clear names and short explanations.
It also opens directly from a cloud integration's Types tile, scoped to that account — see Coverage view.
What you'll find
Every resource type is a card showing its cloud, category, a short description, and how many measures we collect for it. Opening a card reveals:
- The basics — which cloud it belongs to, how the data is collected (e.g. Azure Monitor, CloudWatch), how often we check, and how many measures we collect out of the total available.
- What we measure — a table with one row per measure:
- Measure — the metric's name.
- What it means — a plain-language description of what the number tells you.
- Unit — how the value is expressed (%, bytes, ms, …).
- Healthy range — a suggested normal band, where one can be derived.
- Collected — whether we gather this measure today.
Every value that can't be shown carries an info icon explaining why rather than a bare dash — so a blank is never a mystery.
Terms explained
A collapsible What do these words mean? primer defines the vocabulary once, so the rest of the page reads plainly:
- Measure — A single number we track over time, such as processor usage or free memory.
- Collected — We are gathering this measure from your cloud account right now.
- Not yet collected — The cloud provider offers this measure, but our platform doesn't gather it yet.
- Healthy range — A suggested normal range; values outside it may be worth a closer look.
- Warning / Critical — Levels worth watching versus levels that usually need attention right away.
Two ways to open it
- Catalogue mode — From the sidebar (Reference → Cloud types reference). Browse every resource type across all clouds, filter by cloud with the tabs, and search by name.
- Coverage mode — From a cloud integration's Types tile. The page is scoped to that one account and reconciles what you have against what we monitor.
Coverage view
A cloud integration's Types tile counts the resource types discovered in that account — every kind of resource the inventory walk found. The catalogue counts the types Beak has a monitoring definition for. These are different numbers, and the coverage view makes the difference explicit.
Opening the reference from the tile shows:
- A headline — for example,
43 of 84 resource types in this account are monitored. - Monitored — the discovered types we have a catalogue for. Each opens to its measures.
- Not covered yet — types discovered in your account with no catalogue entry.
For a monitored type, the Collected column is verified from your telemetry — a measure is marked collected only when Beak has actually recorded a value for your resources, not because the catalogue lists it.
A View full catalogue link returns to the all-clouds catalogue.
Why a measure isn't collected
When a measure isn't collected, the coverage view shows a provider-verified reason — derived by comparing your cloud provider's own metric catalogue (Azure Monitor metricDefinitions / AWS CloudWatch ListMetrics) against what Beak records:
- On our roadmap — Your cloud publishes this measure and Beak doesn't collect it yet.
- Needs a per-item breakdown — Available, but it needs a per-dimension query Beak doesn't pull yet (e.g. per-disk).
- Not a standard platform metric — Your cloud doesn't expose it as a platform metric; it may be retired, or only available via other telemetry (Prometheus, Logs, App Insights).
- No metrics for this type — Your cloud publishes no metrics for this resource type (configuration / identity objects).
- Not yet checked — The provider hasn't been probed yet for this measure.
Note: Reasons are computed from the provider's live metric catalogue, so they stay accurate as the provider adds or removes metrics — nothing is hand-maintained.
Enabling coverage reasons
Verified collection and reasons are controlled by a single platform-wide toggle — Platform Settings → Cloud → "Cloud metric coverage reasons" (off by default). A Beak admin enables it once; there is nothing for tenants to configure.
Once enabled, coverage refreshes automatically after every cloud sync — both the manual Sync action on an integration and the scheduled background sync. Until it's on, the coverage view shows verified collection with a hint pointing here.
Where the information comes from
Everything on this page is derived from Beak's cloud monitor catalogue — nothing is hand-maintained per tenant:
- Descriptions come from a curated glossary of common measures, falling back to a plain description generated from the measure's own name.
- Healthy ranges are computed from the alert thresholds defined for that measure. A measure with no threshold shows "No standard range" with an explanation.
- Collected is verified from your telemetry — what Beak has actually recorded for your resources. Each not-collected measure carries a provider-verified reason when coverage reasons are enabled.
Best Practices
- Use coverage mode when onboarding a new cloud account — the "Not covered yet" list tells you exactly which of the account's resource types fall outside Beak's monitoring today.
- Treat the healthy ranges as starting points — they mirror the default alert thresholds, which you can tune per environment on the Alerts page.
- Reach for the catalogue mode as a reference when deciding what a given cloud service is worth alerting on.
Related Pages
- Cloud — Cloud integrations, inventory sync, and the Types tile that opens the coverage view
- Connectors — The catalog of data sources and per-connector setup
- Monitors — The individual monitors created for covered resource types
- Alerts — Rules and thresholds behind the suggested healthy ranges