Alerts
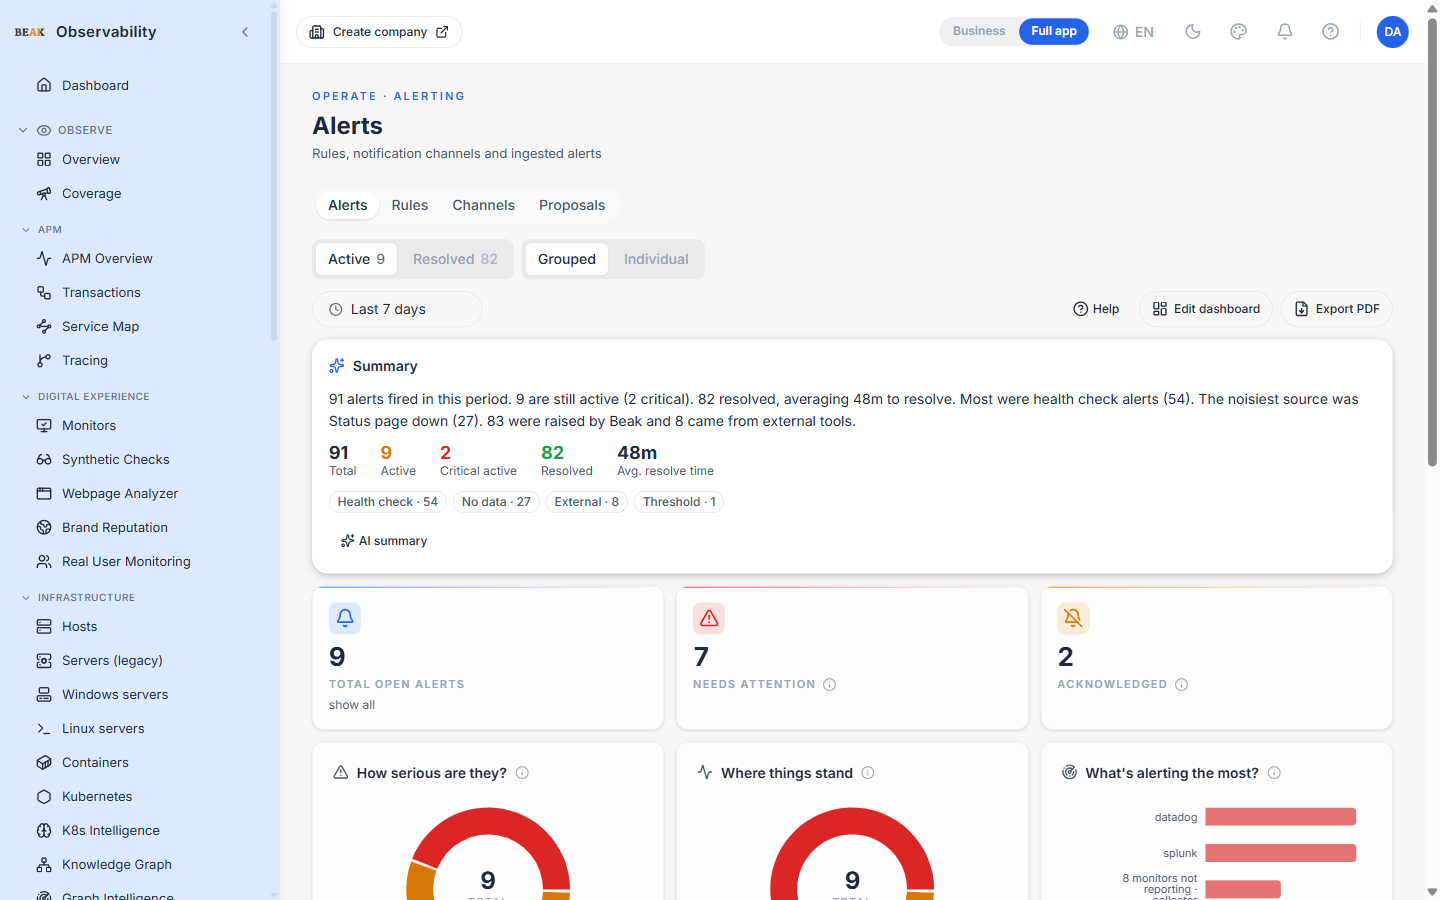
The Alerts page sits under the OPERATE · ALERTING eyebrow and is the operational home for everything alerting: the unified feed of every firing alert across rule-engine and ingested sources, the catalog of alert rules, the notification channels they fire to, and the proposal queue of suggested new rules. The page lead reads "Rules, notification channels and ingested alerts".
Tabs
The page is organised into four tabs:
- Alerts — The unified feed
- Rules — Alert rule definitions
- Channels — Notification channels (Slack, email, PagerDuty, webhooks, etc.)
- Proposals — Suggested rules generated from observed patterns
Overview
The top of the Alerts tab is a plain-language, click-to-explore overview built for readers who don't live in the alerting internals. Every tile and chart is clickable and filters the feed below; clicking the same target again clears the filter.
- Headline tiles —
Total alerts,Needs attention,Acknowledged,Resolved, using the true counts for the selected time range. - How serious are they? — Alerts grouped by urgency (critical / warning / info).
- Where things stand — How many alerts still need attention versus already acknowledged or resolved.
- What's alerting the most? — The rules and resources raising the most alerts — the best places to look or fine-tune first.
The severity and noisiest-sources panels are computed from the whole selected window (not just the loaded rows), so the numbers are accurate at scale. A plain-English activity summary sits above the tiles, with an optional AI narrative on demand.
Note: The overview — tiles, charts and the activity summary alike — follows the Alerts feed's Grouped / Individual view toggle. Grouped collapses clustered alerts into one row per group; Individual counts every raw alert. Switching the toggle recomputes the whole overview so its numbers always match the feed below.
Alerts Feed
The Alerts tab combines two sources into one row set:
- Rule-fired alerts — Internal evaluator, K8s auto-alerter, connector rules — anything attached to an alert rule
- Ingested alerts — Webhook or Kafka ingest from Datadog, Splunk, PagerDuty, and other external sources
Each row shows its origin inline in the Alert column; everything else (severity, status, time, summary) is normalised.
Filters and toggles
The toolbar exposes three toggles for alerts that are normally hidden:
- Snoozed — Show alerts the operator silenced for a window
- Muted — Show alerts a maintenance window muted
- Suppressed — Show alerts the topology-aware dedup pass folded into a parent alert
- Grouped / Individual — Collapse clustered alerts into one row per group, or expand to every raw alert. The overview above follows this choice, so its counts and the feed always agree.
The time window selector (1 h / 24 h / 7 d / 30 d) drives the server-side started_at filter; the default is Last 7 days.
Columns
The feed uses a condensed three-column layout: Urgency, Alert, and Started. The Urgency column shows the priority badge (P1 / P2) and the live status (FIRING / ACKNOWLEDGED). The Alert column packs the summary together with its origin — the source (e.g. datadog, pagerduty, rule), whether it is Internal or External, and the signal type. The Started column shows the relative time the alert first fired. The feed is sorted newest first (by Started, descending) by default.
The column picker (the gear icon in the toolbar) toggles the optional columns, which are remembered per user:
- Display ID — The human-friendly alert id, shown by default. Rule-fired alerts carry an
INC-…id (they share the rule-engine incident numbering); ingested alerts carry anAL-…id. - UUID — The raw internal identifier, hidden by default — enable it to correlate a row with the API or logs.
- Resolution note — Why a resolved alert was closed (empty while the alert is still firing).
- Custom data — A yes/no indicator of whether the row carries captured payload attributes, with a filter to narrow to rows that do.
Separately, the Custom Data Columns picker in the toolbar adds one column per captured payload attribute you choose — distinct from the column picker above, which toggles the built-in columns.
Row actions
Each row exposes:
- Acknowledge — Mark the alert as being handled
- Resolve — Close the alert. A short dialog asks for a resolution note (why it's being closed); the note is required, saved with the alert, and shown on the resolved row and in its detail dialog.
- Snooze — Hide for a chosen window
- Silence — Suppress notifications without resolving
- Open detail — Full payload, custom data and notes
Resolving a clustered alert group asks for one note and applies it to every member the group-resolve closes. When the platform auto-resolves an alert (the condition clears, a forecast recovers, an upstream source reports resolution), it records a system-generated resolution note automatically.
Export
The Download report action exports the rows currently visible (after filters and search) as CSV. The file includes a window slug in its filename so a "Last 7 days" export is recognisable later.
Alert detail
Opening a row (the Open detail action, or a click on the row) shows the full alert — payload, custom data and notes — across an Overview and an Analyse tab. Three panels help you act on it:
- Related incident — The incident this alert was promoted into, if any. It appears for both rule-fired and ingested alerts and links straight through to the Incidents page, opening that incident even when it falls outside the incident list's current window. An alert that was never promoted (no matching incident rule fired) shows a short "not promoted" note instead.
- How it was resolved — For a resolved alert, the operator's resolution note is surfaced prominently at the top of the
Overviewtab, so what fixed it is the first thing you see. - Suggested fix — For an open alert, the
Analysetab surfaces how the same recurring alert was resolved before: the resolution notes from past resolved occurrences that share its rule (rule-fired) or fingerprint (ingested), most recent first. When an AI provider is configured it adds a one-line suggested fix distilled from those notes; otherwise the raw notes are shown. Results are scoped to the company you have selected.
Rules
The Rules tab lists every alert rule the tenant has defined. Each rule has a name, a condition, a severity, a window, and a set of notification channels. Use the + New rule button to add one; the dialog walks through the condition (metric > threshold for window), the channels and the severity.
Channels
The Channels tab lists notification destinations. Supported types include Slack, Microsoft Teams, email, SMS / WhatsApp / voice (Twilio), and generic webhooks. Each channel can be referenced by multiple rules; deleting a channel checks for outstanding references first.
Event selection
Each channel chooses exactly which events it fires on, via four checkboxes:
- Rule-fired alerts — Alerts raised by your alert rules and Beak's detectors.
- Ingested alerts — Alerts received from external systems (webhook / API / Kafka).
- Promoted incidents — Incidents the platform promotes from alerts.
- Ingested incidents — Incidents received from external ITSM systems.
The Ingested alerts and Ingested incidents events drive the outbound AI-agent webhook (below). Channels created before this feature are unchanged: an empty selection falls back to the legacy notify-on mapping (alerts → rule-fired alerts, incidents → promoted incidents, both → both).
Custom headers
A webhook channel can attach custom HTTP headers that are sent with every POST. Add a Header name and Header value, click Add, and the committed header appears as a removable row. This is how you pass the auth header a receiving AI agent (or any endpoint) expects — for example X-Agent-Key.
Outbound agent webhooks
When a webhook channel opts into Ingested alerts or Ingested incidents, the platform POSTs each ingested — and every re-ingested — record to the channel's URL with the configured headers. The default JSON body carries event_type (alert_ingested / incident_ingested), id, display_id, source, status, severity, a summary or title, attributes, and a deep link. Delivery is best-effort and never delays ingest.
Note: Webhook URLs must use
https— plainhttpis rejected by the outbound safety guard. Point the channel at your agent'shttpsendpoint.
Proposals
The platform's pattern-recognition layer suggests new alert rules based on observed signal patterns (e.g. "spike in error rate every Monday at 09:00"). The Proposals tab lists current suggestions; accepting one materialises a real rule, dismissing one prevents the suggestion from reappearing.
Best Practices
- Treat the
Origincolumn as a quick disambiguator — rule-fired alerts have a runbook in the team's docs; ingested alerts need an upstream link. - Snooze instead of resolve when you need a window to investigate — the alert reappears automatically once the snooze expires.
- The Channels page is the right place to enforce a per-team naming convention (e.g.
slack:on-call-payments); rules pick channels by name in their definition. - Accept proposals selectively — a high acceptance rate on noise proposals trains the suggester to surface more noise. Dismiss what isn't useful.
Related Pages
- Ingested Alerts — Source-scoped view of just the externally-ingested alerts
- Incidents — Cases opened on top of one or more firing alerts
- Monitors — Synthetic monitors whose status changes feed the rule engine
- Settings — Alert ingest setup for Datadog / Splunk / etc.