BEAK ITSM — Enterprise IT Service Management
BEAK ITSM is a comprehensive, ITIL-aligned IT Service Management platform that unifies ticket management, incident response, change control, and service delivery into a single pane of glass — enabling teams to achieve 100% SLA compliance and reduce average resolution time to under 5 hours.
Key Capabilities
Unified Ticket & Incident Management
Manage the full lifecycle of tickets and incidents from creation through resolution. Tickets follow a clear workflow — Open, In Progress, Pending, Resolved, Closed — with built-in SLA tracking, priority-based escalation, and full audit trails.
Service Catalog & Request Fulfillment
A self-service catalog with 15+ pre-built service offerings across IT Equipment, Software, Access Management, Onboarding, Network, and more. Each service includes defined SLA targets and approval workflows.
ITIL-Aligned Problem & Change Management
Identify root causes with Problem Management, document workarounds in the Known Error Database (KEDB), and govern infrastructure changes through a formal Change Advisory Board (CAB) review process with risk assessment.
Configuration Management Database (CMDB)
Track and manage all configuration items (CIs) across your infrastructure with environment classification, criticality ratings, and ownership tracking. Includes Business Services catalog, automated Discovery Management, visual Network Map topology, and CMDB Analytics for data completeness monitoring.
Workflow Automation & Form Builder
Automate routine ITSM processes with configurable workflows for incident auto-assignment, service request approvals, SLA breach notifications, and more. Design custom forms per workspace, ticket type, and category using the drag-and-drop Form Builder.
Knowledge Base & Self-Service
Build a searchable library of articles, guides, and documentation to enable self-service resolution and reduce ticket volume. Track article views and organize by category.
Workspace-Based Multi-Team Support
Organize service delivery across multiple teams with dedicated workspaces — IT, HCM, Facilities, Admin, Travel, Immigration, and more — each with independent dashboards and SLA tracking.
Reports & Analytics
15+ built-in reports covering ticket volume, SLA compliance, MTTR analysis, agent performance, CSAT scores, incident trends, change success rates, and custom field analytics.
ITSM Dashboard
The ITSM Dashboard provides a real-time overview of your service management operations. The dashboard is workspace-aware — select a specific workspace to see scoped metrics, or choose All Workspaces for an aggregated view. Use the Team / My Work toggle to switch between team-level metrics and your personal workload.
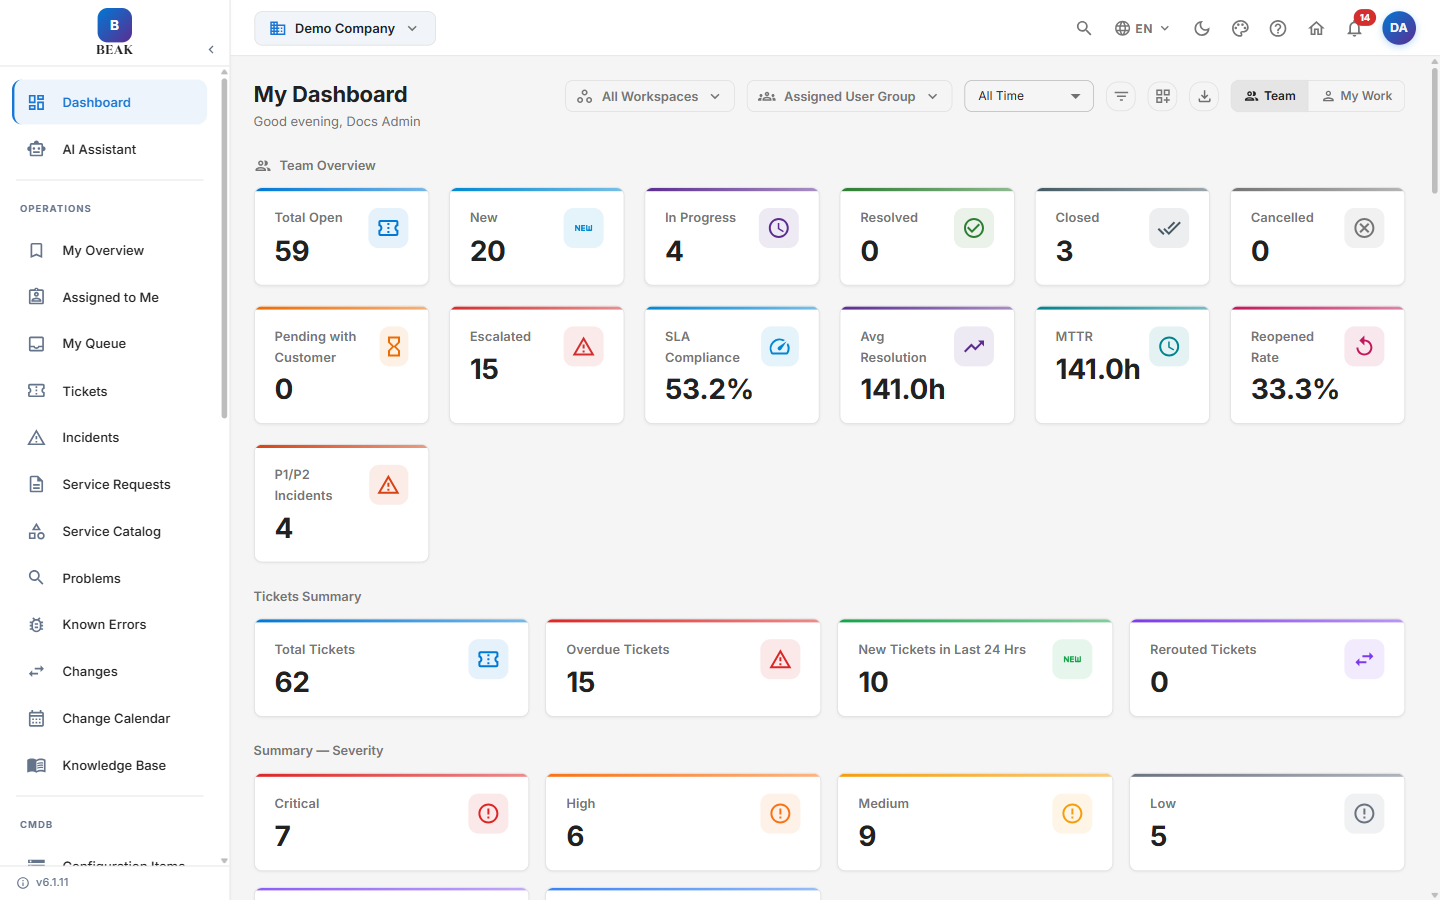
Dashboard Controls
- Workspace selector — Scope all metrics to a single workspace or All Workspaces
- Assigned User Group — Scope metrics to the tickets assigned to a specific user group (queue or team)
- Time range — Filter the dashboard to a period (defaults to All Time)
- Team / My Work toggle — Switch between team-level metrics and your personal workload view
- Filter by Person / Filter by Location — Scope metrics by agent or physical location
- Customize Dashboard — Toggle and reorder dashboard widgets
- Export — Export the current dashboard data to a file
Team Overview
Top-line counts for the selected scope:
- Total Open — All open tickets
- New — Newly created, not yet triaged
- In Progress — Tickets actively being worked
- Resolved — Tickets resolved in the period
- Closed — Tickets closed in the period
- Cancelled — Cancelled tickets
- Pending with Customer — Tickets paused while awaiting a customer response
- Escalated — Tickets that have been escalated
- SLA Compliance — Percentage of tickets meeting SLA targets
- Avg Resolution — Mean time to resolve tickets
- MTTR — Mean time to restore service across resolved tickets
- Reopened Rate — Percentage of resolved tickets that were reopened
- P1/P2 Incidents — Count of the highest-priority incidents in scope
Note: The KPI card set is configurable. Use Global Settings → Custom KPI Card to add custom dashboard tiles and to reorder or hide cards independently for the Team and My Work views.
Tickets Summary & Severity
- Tickets Summary — Total Tickets, Overdue Tickets, New Tickets in Last 24 Hrs, and Rerouted Tickets
- Summary — Severity — Ticket counts by severity (
Critical,High,Medium,Low,Major,Minor)
Dashboard Charts
The dashboard presents a comprehensive set of analytics widgets:
- Source Vs Tickets — Ticket volume by origin (Portal, Beak Desk, AI Agent, and more)
- Top 5 Category / Subcategory Vs Tickets — The most common categories and subcategories
- Top 5 User Groups Vs Categories and Top 5 Assigned User Groups Vs Tickets — Workload across queues and assignee groups
- Country / Vertical / Account Vs Tickets — Ticket distribution by geography, vertical, and account
- Tickets by Type — Split across Ticket, Incident, Service Request, Problem, and Change Request
- Top Assignees by Open Tickets — Agents ranked by open ticket count
- SLA Breach Warning — Tickets approaching SLA breach within a configurable time window
- Ticket Trends — Line chart comparing ticket creation vs. resolution over time
- Ticket Distribution — Donut chart breaking tickets down across the full status lifecycle
- Ticket Count by Age — Open tickets bucketed by age (
0–1d,1–3d,3–7d,7–30d,30d+) - SLA — Assignment & Completion — Response and resolution SLA performance (met / breached / pending)
- Tickets by Department & Category — Cross-tabulated ticket volume
- Recent Activity — Live feed of ticket actions including status changes, stage transitions, assignments, and emails
Navigation Structure
BEAK ITSM organizes its features into four main sections accessible from the left sidebar.
Operations
| Module | Description |
|---|---|
| Dashboard | Real-time overview with workload metrics, SLA compliance, and ticket trends |
| My Overview | Overview of tickets you created or were requested for, across all types |
| Assigned to Me | Tickets currently assigned to you for resolution |
| My Queue | Your personalized work queue |
| Tickets | Create, track, and resolve support tickets with full lifecycle management |
| Incidents | Report, triage, and resolve unplanned service interruptions |
| Service Requests | Browse the service catalog and submit requests with approval workflows |
| Service Catalog | Self-service catalog of available IT services |
| Problems | Identify root causes and manage Known Errors |
| Known Errors | KEDB — Documented known errors and workarounds |
| Changes | Submit RFCs, manage CAB review, and track implementation |
| Change Calendar | Monthly calendar view of all scheduled changes |
| Knowledge Base | Articles, guides, and self-service documentation |
CMDB
| Module | Description |
|---|---|
| Config Items | Track and manage all infrastructure CIs with environment and criticality classification |
| Services | Catalog of IT and business services with ownership and status tracking |
| Discovery | Automated CI discovery with jobs, credentials, collectors, and activity logging |
| Network Map | Visual topology map showing CI relationships and connectivity |
| Graph Insights | Knowledge-graph analysis of derived CI relationships, including single points of failure |
| Graph Explorer | Interactive graph exploration from any CI, ticket, service, article, person, or queue |
| Analytics | Data completeness monitoring, field coverage, and CI distribution analysis |
| Assets | IT asset register with lifecycle status, allocation, and warranty tracking |
| My Assets | Self-service view of the configuration items allocated to you |
Administration
| Module | Description |
|---|---|
| Employees | Employee directory with organizational hierarchy |
| Workflows | Automation rules and workflow definitions |
| Workflow Instances | Live execution log of all workflow runs |
| Form Builder | Custom ticket form design per workspace, type, and category |
| Workspaces | Multi-team workspace configuration and management |
| Company Config | Company-level configuration and settings |
| Global Settings | SLA policies, categories, queues, notifications, SSO, and system configuration |
Analytics
| Module | Description |
|---|---|
| Reports | 15+ built-in reports covering tickets, incidents, changes, satisfaction, and custom analytics |
| Client Overview | Organization-wide, multi-client analytics summary of volume, SLA, severity, and aging |
Key Metrics
| Metric | Value |
|---|---|
| Avg Resolution Time | 4.2 hours |
| SLA Compliance | Up to 100% |
| Service Catalog Items | 15+ pre-built |
| Report Types | 15+ analytics reports |
| Workspace Support | 10+ team workspaces |
Getting Started
- Load Demo Data — Navigate to Global Settings and use the Load Demo Data function to populate your instance with ITIL-standard reference data, categories, workflows, and sample records.
- Configure Workspaces — Set up Workspaces for each team or department in your organization.
- Set SLA Policies — Define response and resolution targets per priority and workspace in Global Settings.
- Customize Forms — Use the Form Builder to tailor ticket intake forms per workspace and category.
- Activate Workflows — Enable pre-built Workflows for incident auto-assignment, approvals, and SLA breach notifications.
- Publish Knowledge Articles — Build your Knowledge Base with common solutions to reduce ticket volume.
Documentation
- Ticket Management — Creating, tracking, and resolving tickets
- Incident Management — Reporting, triaging, and resolving incidents
- Service Requests & Catalog — Requesting services and browsing the catalog
- Problem Management — Root cause analysis and Known Error Database
- Change Management — RFCs, change types, and the Change Calendar
- CMDB — Configuration items, services, discovery, network map, and analytics
- Assets — IT asset register with lifecycle, allocation, and warranty tracking
- My Assets — Configuration items allocated to the signed-in user
- Knowledge Base — Articles, guides, and self-service documentation
- Workspaces — Multi-team workspace configuration
- Workflows — Automation rules and workflow definitions
- Form Builder — Custom ticket form design
- Settings & Configuration — SLA policies, categories, queues, and system settings
- Reports & Analytics — Dashboards, metrics, and analytics reports
- Client Overview — Organization-wide, multi-client analytics summary