Databases
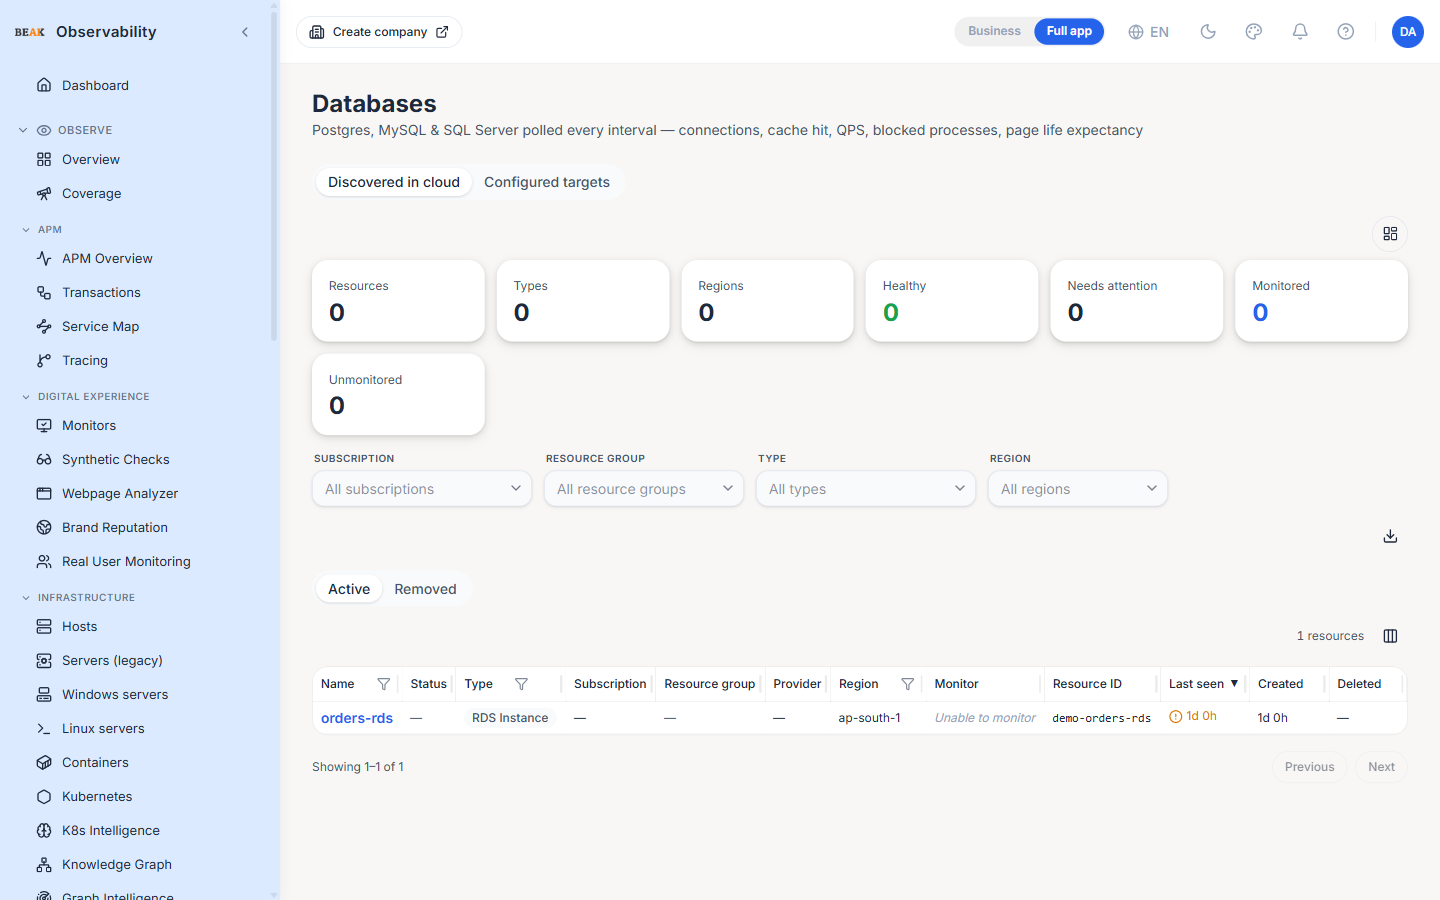
The Databases page is the inventory for every database target the tenant monitors. It has two tabs:
- Discovered in cloud — Cloud-managed databases (RDS, DynamoDB, Cosmos DB, Azure SQL, Azure managed Postgres / MySQL / MariaDB, Mongo Atlas, Spanner, Firestore, Bigtable) discovered automatically from each cloud integration
- Configured targets — Manually registered Postgres / MySQL / SQL Server targets polled on a per-target interval
Configured Targets
Each row in the Configured tab represents a manually registered database connection. Columns:
- Status —
up,down,pending; the most recent error appears beneath adownstatus - Name — Display name; clicking it opens the database detail view with time-series charts
- Engine —
postgres,mysql, ormssql - Interval — Poll interval in seconds
- Last check — Relative time since the last poll
- Actions — Test connection, delete (visible to users with
databases:write)
The + Register DB target button opens a dialog with three fields:
- Name — Display name for the target
- Engine — Postgres, MySQL, or SQL Server
- DSN — Connection string (placeholders show the expected format per engine)
- Interval — Poll cadence in seconds (default 60)
Discovered in Cloud
The Cloud tab cross-references the connected cloud integrations and surfaces every resource type the platform recognises as a database. Filters apply across providers — AWS RDS / DynamoDB, Azure SQL and Cosmos, Azure managed Postgres / MySQL / MariaDB, Mongo Atlas, and GCP Spanner / Firestore / Bigtable.
Note: ElastiCache and
microsoft.cacheresources are deliberately surfaced on the Middleware view instead, since they're caching workloads rather than primary databases.
Drill-down From Connectors
The Connectors page deep-links into this page with the ?engine= query parameter so a user clicking the Postgres connector card lands on the Configured tab pre-filtered to Postgres. A chip near the title shows the active filter and offers a one-click clear.
Detail View
Clicking a configured target's name opens its detail page. The detail page surfaces:
- Recent poll samples on a time-series chart
- Per-poll samples table with the captured metrics (connections, cache hit, QPS, blocked processes, page life expectancy depending on engine)
- Connection metadata and the masked DSN
Best Practices
- Use the Cloud tab first for cloud-managed databases — discovery is automatic, no DSN handoff required.
- Reserve Configured targets for on-prem or self-hosted databases where automatic discovery isn't possible.
- A high poll interval (e.g. 300 s) is appropriate for slow-changing metrics; a low interval (15 – 30 s) is useful when chasing transient connection issues.
- The Test action on a target row sanity-checks the DSN and returns the first sample inline — useful right after registering a new target.
Related Pages
- Connectors — Database connector cards and setup instructions
- Cloud — Cloud integrations that drive the Discovered tab