Kubernetes
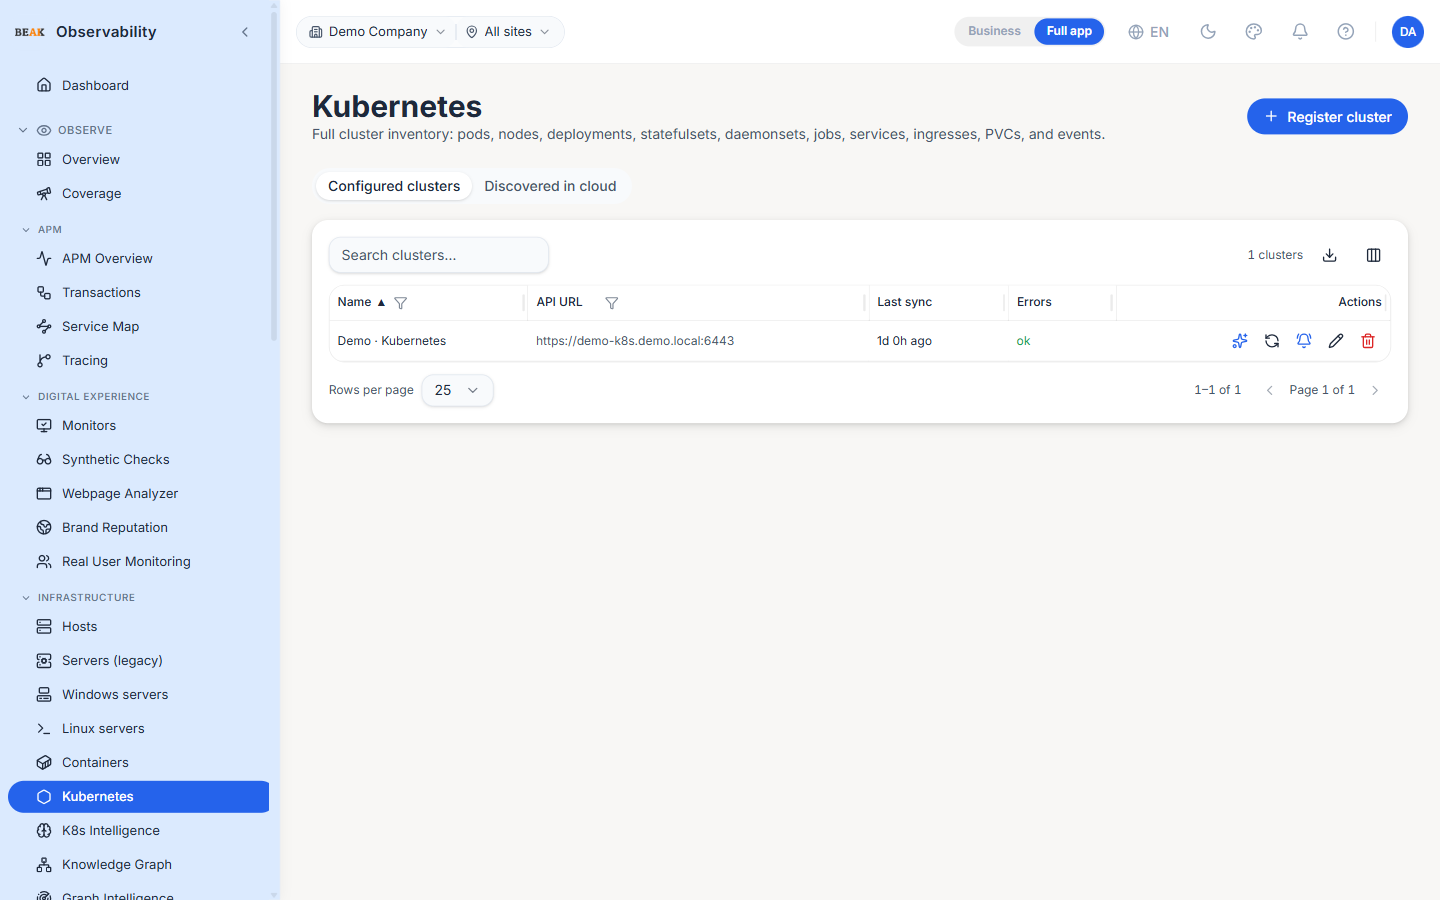
The Kubernetes page registers and inspects every Kubernetes cluster the tenant manages. The page lead reads "Full cluster inventory: pods, nodes, deployments, statefulsets, daemonsets, jobs, services, ingresses, PVCs, and events." A Register cluster button in the top right opens the registration dialog.
Each cluster gets an inventory sync that populates the resource tables (pods, nodes, deployments, statefulsets, daemonsets, jobs, cronjobs, services, ingresses, PVCs, namespaces and events). The page also surfaces topology and the pod-level dashboard.
The cluster list itself is a small table with five columns: Name, API URL, Last sync, Errors, Actions. Click a cluster row to open its detail view.
Register a Cluster
The Register cluster button opens a dialog with four auth modes:
- Bearer token — API URL and a bearer token; simplest path
- Kubeconfig — Paste the entire kubeconfig YAML; useful for clusters with multiple auth contexts
- OIDC — Token endpoint, client ID, client secret, optional username / password / scope / audience for a programmatic federated login
- Azure AKS — Resource ID of an AKS cluster; the platform exchanges the configured Azure credentials for a cluster token
After registration the first sync starts immediately. The row shows Syncing until the first inventory pass completes; large clusters can take up to a minute.
Resource Tabs
A tab per resource kind switches the table contents:
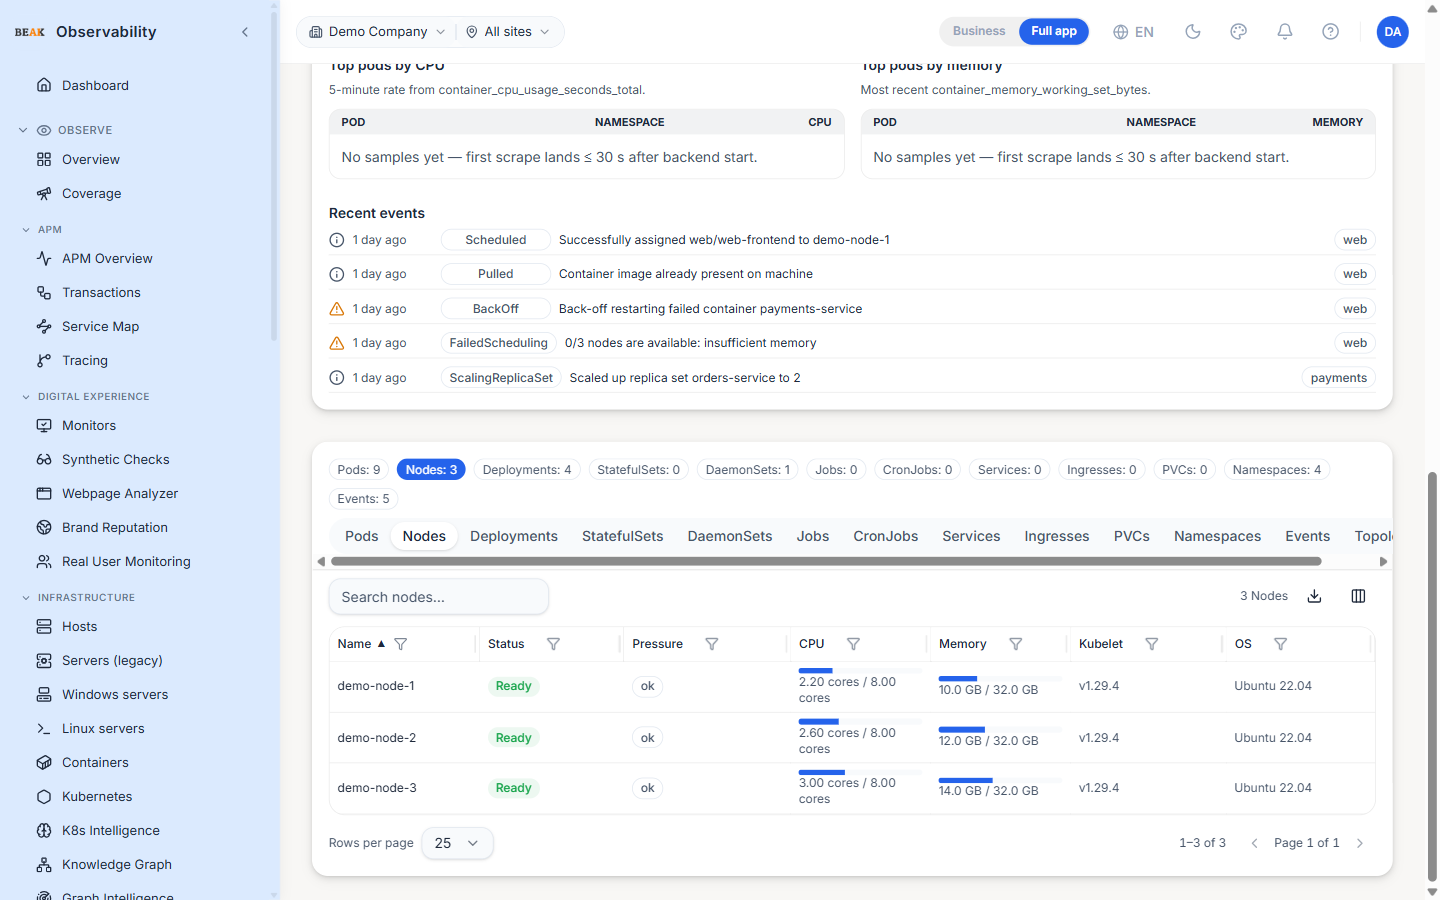
- Pods, Nodes, Deployments, StatefulSets, DaemonSets, Jobs, CronJobs
- Services, Ingresses, PersistentVolumeClaims
- Namespaces, Events
- Topology — a graph view of cluster relationships
The Pods, Nodes and Deployments tabs surface inline status badges driven by the readiness / availability of each resource.
Cluster Detail
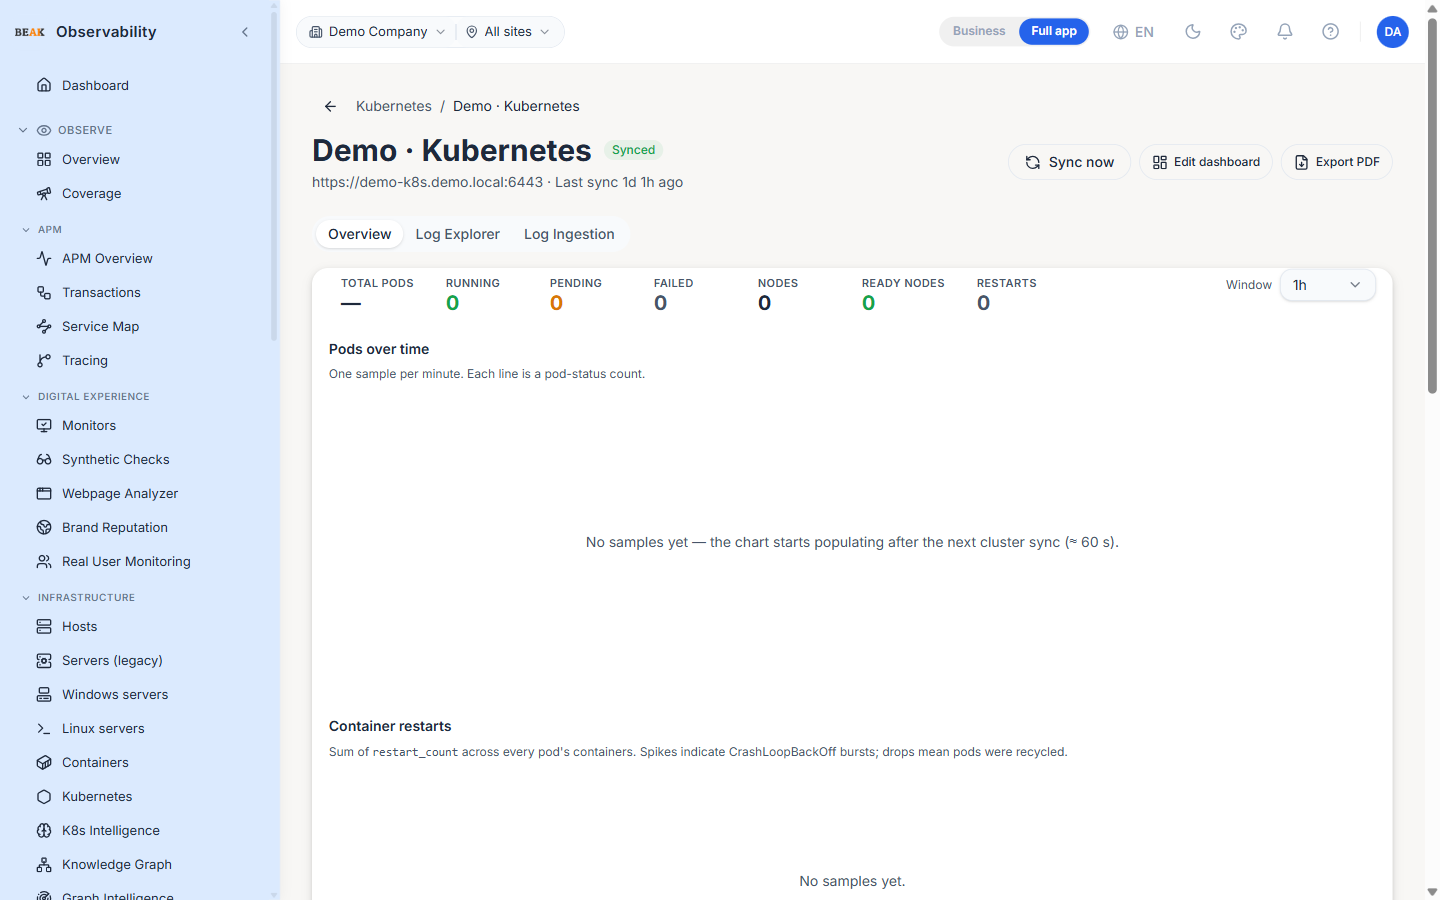
Clicking a cluster row navigates to the detail view, which opens on a cluster dashboard — headline counters (total / running / pending / failed pods, nodes, ready nodes, restarts), a Pods over time chart and a Container restarts chart over a selectable window — with the resource tabs below. It also adds:
- A per-namespace breakdown
- A topology subview for the selected cluster
- Cluster-scoped metrics (node count, pod count by phase, recent events)
Pod Dashboard
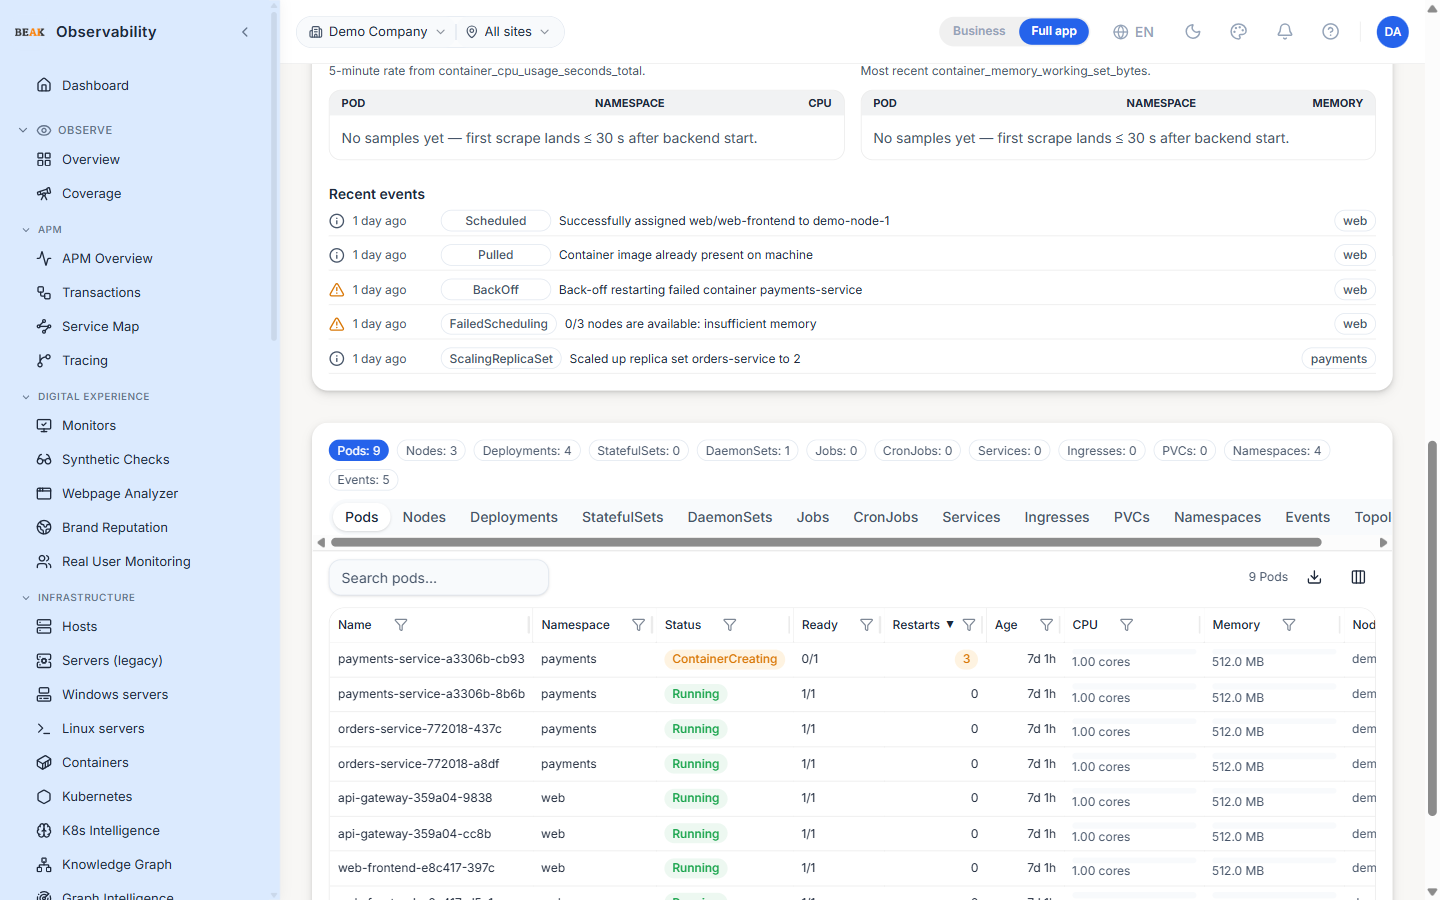
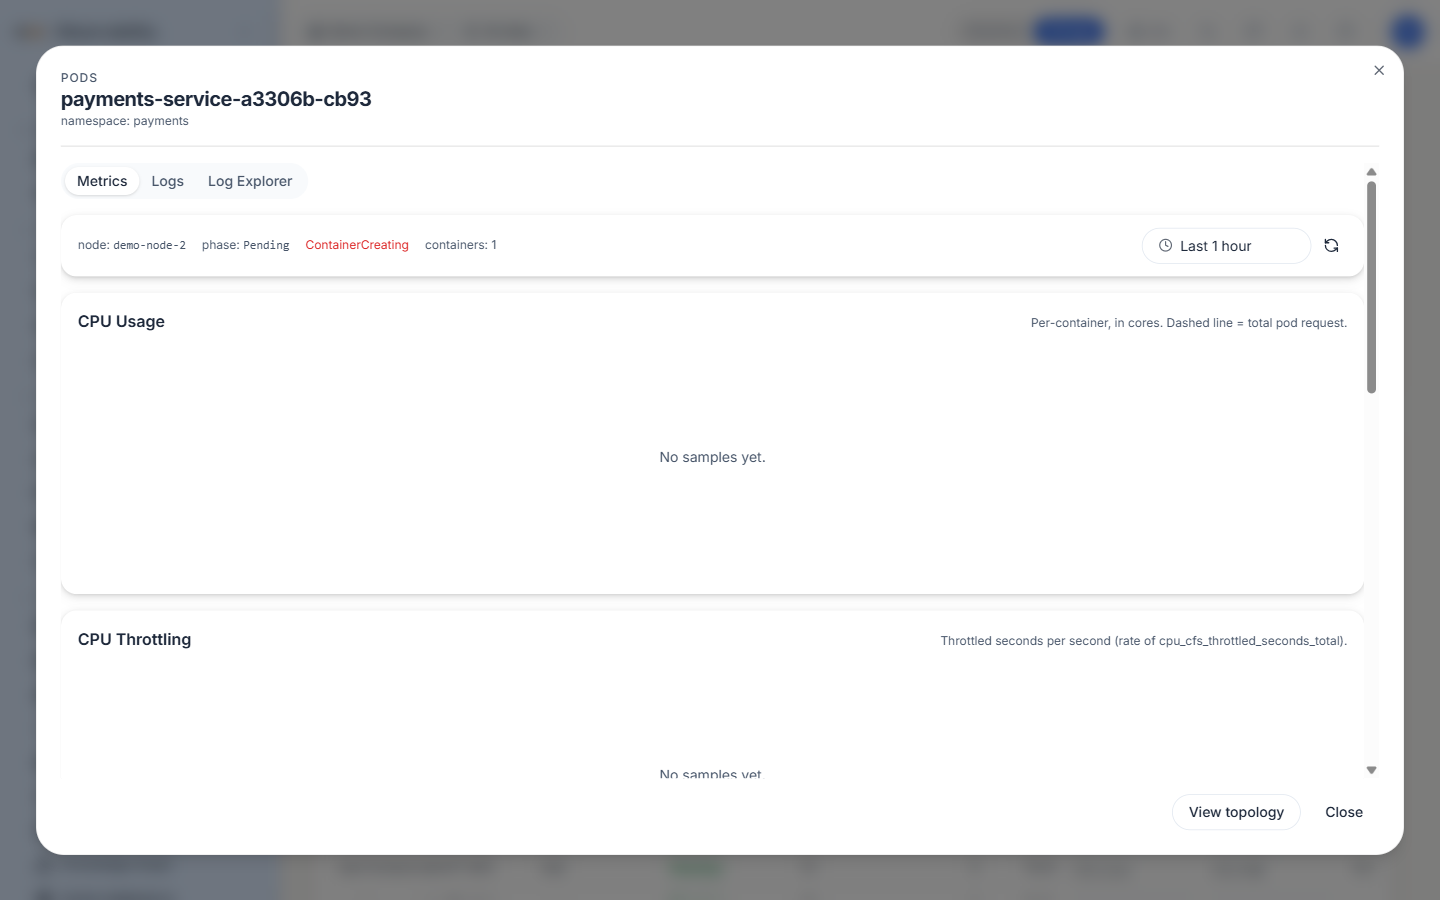
Clicking a pod row opens the dedicated per-pod dashboard, split into three tabs:
- Metrics — a panel scoped to that pod with a selectable time window, per-container CPU usage (with the total pod request as a dashed line), CPU throttling, memory, and network I/O, plus a
View topologyshortcut into the graph. - Logs — live pod logs pulled straight from the cluster (see Pod Logs (Live) below).
- Log Explorer — stored, historical logs with root-cause insights (see Log Explorer below); available once Log Ingestion is enabled for the cluster.
The dashboard opens on the Metrics tab; logs are fetched only when you open the Logs or Log Explorer tab.
Pod Logs (Live)
The Logs tab on the pod dashboard tails a pod's logs live from the cluster API server. Logs are read on demand and not stored — this is a live, single-pod view (the tail is lost when the container restarts), so it is the fastest way to see what a pod is doing right now without any collector or ingestion setup.
Controls
- Container — pick which container's logs to show; defaults to the first container and is required for multi-container pods.
- Lines — how many trailing lines to fetch (100 / 500 / 1000 / 5000).
- Since — restrict to a look-back window (All / 5m / 15m / 1h / 6h / 24h).
- Previous (crashed) instance — show the last terminated container's logs instead of the running one. Use this to triage
CrashLoopBackOffandOOMKilledpods, whose logs would otherwise be gone. - Auto-refresh (10s) — re-fetch the tail every ten seconds.
- Refresh — re-fetch on demand.
- Search within results — filter the fetched lines by substring.
Log levels (ERROR, WARN, INFO, …) are colour-coded, and a volume histogram above the log body shows throughput over the fetched window — hover a bar to see its time range and line count.
Download
The Download menu at the bottom-right of the log panel writes the logs to a .txt file:
- Visible logs — exactly what is on screen, honouring the current container, line, window and search filters.
- All logs — the full retained log for the selected container, ignoring the line and time filters (bounded by a size cap for safety).
Requirements
Note: The stored cluster credential must be allowed to read pod logs —
geton thepods/logsubresource. If it is not, the Logs tab shows a clear "lacks the 'pods/log' permission" message instead of logs; grant that verb to the credential's role and retry.
Live logs are ephemeral and scoped to a single pod. For stored, historical, cross-restart, queryable logs, enable Log Ingestion and use the Log Explorer.
Log Explorer (Stored Logs)
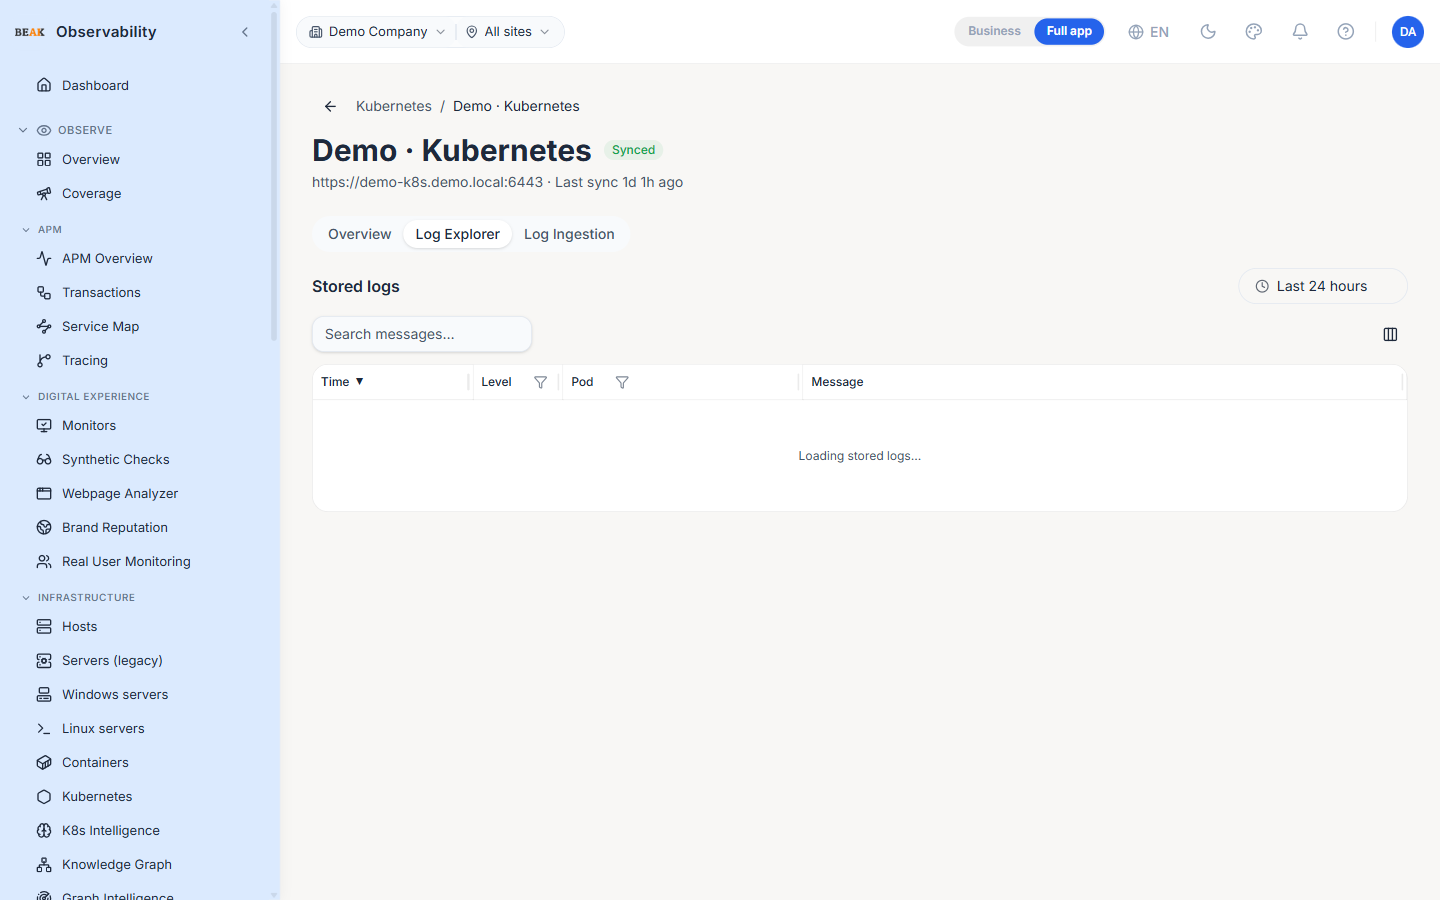
Once Log Ingestion is enabled for a cluster, the Log Explorer searches its stored logs — historical, cross-restart, and queryable — rather than a live tail. It appears in two places:
- Cluster detail → Log Explorer tab — across every pod and namespace in the cluster.
- Pod dashboard → Log Explorer tab — pre-scoped to that one pod.
Root-cause insights
Above the log table, an insights strip summarises the window to answer "what broke, and why":
- Error / warning counts for the selected window.
- Top recurring errors — similar messages are clustered (ids, timestamps and numbers are normalised away) and ranked by occurrence count. Click a signature to filter the table to just those occurrences, so you can see which pod and at what time each happened.
- Failure correlation (pod-scoped) — when the pod's own status shows
CrashLoopBackOff,OOMKilledorFailed, a banner ties that failure to the errors below.
Browsing
- Standard adjustable time range (presets down to 5 minutes, plus a custom range).
- Level colour-coding, full-text search, and click-to-expand row detail (pod, namespace, node, container, and raw attributes).
- Cluster view: each row's pod name links to that pod's dashboard (metrics + logs). A pod that isn't in the cluster's current synced inventory is shown without a link (its metrics dashboard isn't available).
Log Ingestion
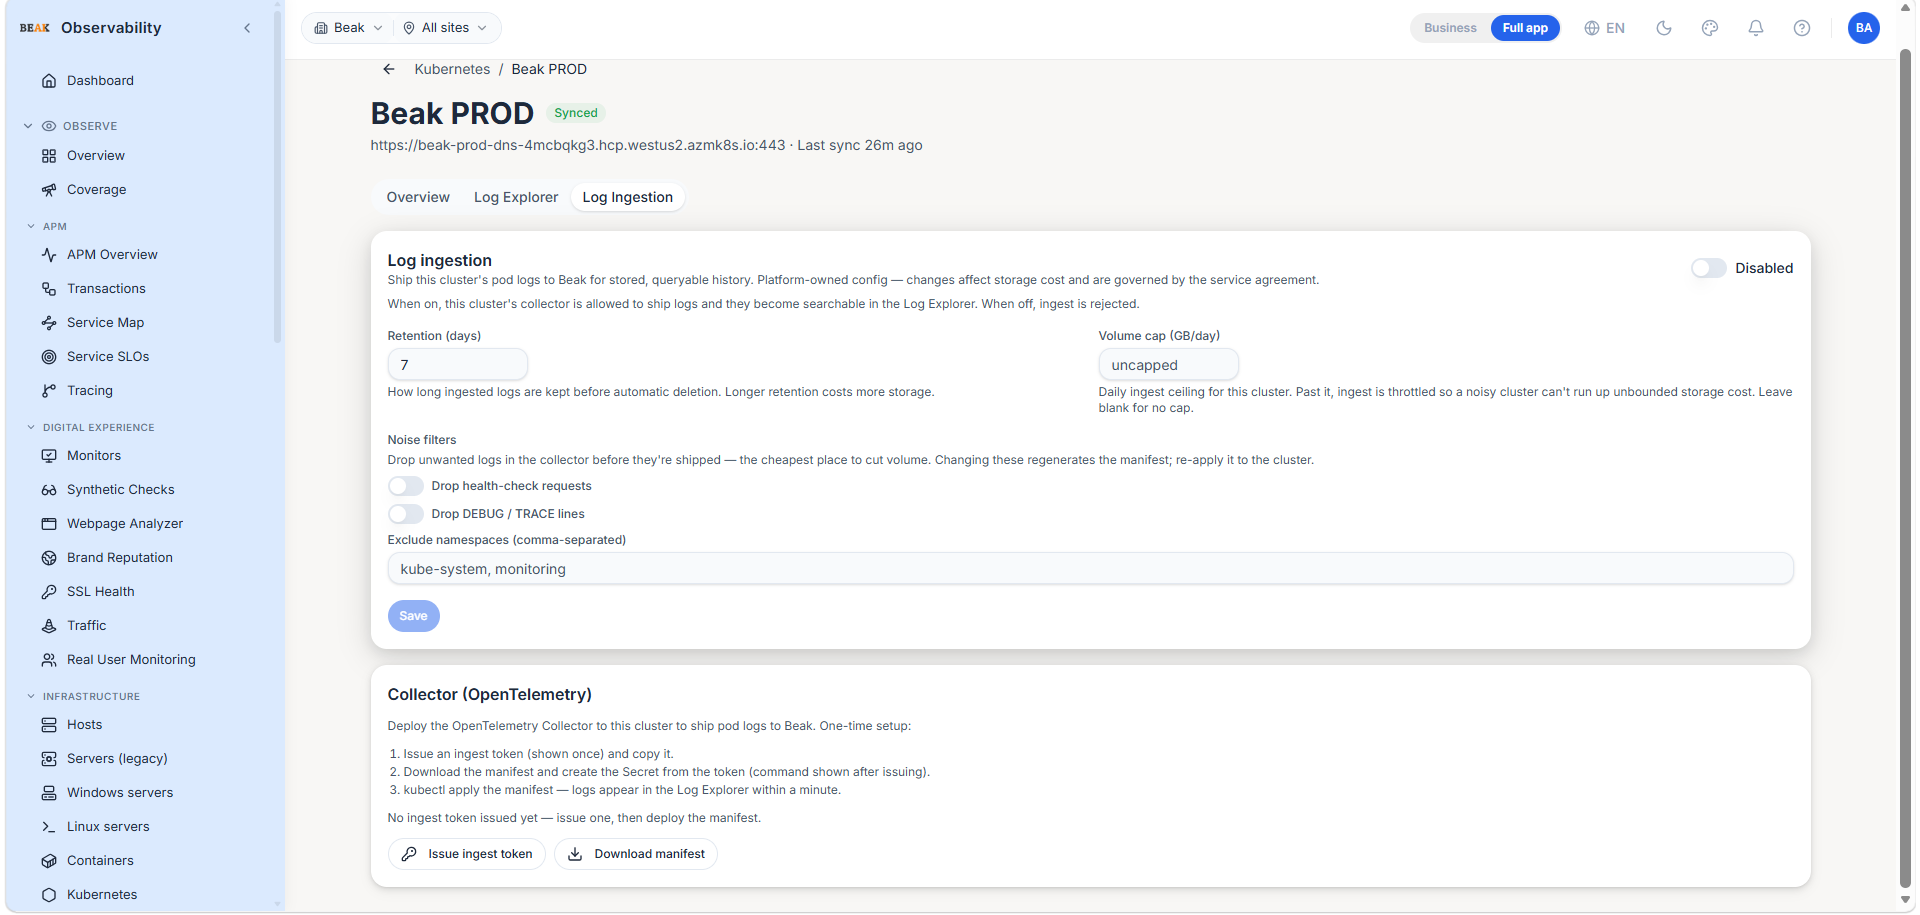
Log ingestion ships a cluster's pod logs to Beak so they can be stored and explored. It is a platform-owned, super-admin-only setting — it issues an ingest credential and sets storage-cost controls, so it is governed by the service agreement rather than changed by end users. The Log Ingestion tab appears on the cluster detail page only for users who hold the log-ingestion admin permission.
Enabling ingestion
- Enable ingestion for the cluster.
- Issue an ingest token — shown once; copy it, then create the Kubernetes Secret it is read from (the exact
kubectlcommand is shown after issuing). - Download the manifest and
kubectl applyit. It deploys an OpenTelemetry Collector DaemonSet that tails container logs, enriches them with Kubernetes metadata (pod, namespace, node, and owning Deployment), and ships them to Beak over OTLP/HTTP. The token is read from the Secret — it is never baked into the downloaded file.
Logs appear in the Log Explorer within about a minute.
Settings (these drive runtime)
- Retention (days) — how long ingested logs are kept before automatic deletion. Longer retention costs more storage.
- Volume cap (GB/day) — a per-cluster daily ceiling; beyond it, ingest is throttled so a noisy cluster can't run up unbounded storage cost. Leave blank for no cap.
- Noise filters — drop health-check requests, DEBUG/TRACE lines, or whole namespaces at source (in the collector, before shipping) — the cheapest place to cut volume. Changing these regenerates the manifest; re-apply it to the cluster.
Note: Rotating the token invalidates the previous one immediately; revoking it stops ingest (subsequent shipments are rejected). Only the token's hash is stored — the plaintext is never persisted or shown again after issue.
Filtering
Per-column funnel filters work on every tab. URL parameters drive the cluster ID and selected tab so any cluster-tab combination is bookmarkable.
Best Practices
- Register one cluster per environment (dev, staging, prod) rather than one cluster per region to keep the resource counts and quotas readable.
- The Bearer-token auth mode is the lowest-friction option for ephemeral integrations; use OIDC or AKS for long-lived production clusters where token rotation matters.
- Events ages and resource ages help separate freshly-created from long-running workloads; sort by Age when triaging restart loops.
- The Topology tab is most useful to onboarding engineers who need the lay of the cluster — production triage usually wants the Pod tab plus K8s Intelligence.
- When triaging a crash loop, open the pod's Logs tab and enable Previous (crashed) instance to read the container that died, then use Download → All logs to attach the full log to an incident.
- For recurring or post-mortem investigation (after a restart wipes the live tail), use the Log Explorer — its top-recurring-errors clustering and failure-correlation banner point at the root cause faster than scrolling raw lines. This needs Log Ingestion enabled; keep retention and the volume cap sized to the agreed storage budget.
Related Pages
- Cluster Map — Plain-language health map of a cluster
- Workloads — Cross-cluster health table of Deployments / StatefulSets / DaemonSets
- K8s Intelligence — Past / current / predicted Kubernetes problems
- Knowledge Graph — Cross-layer graph that includes Kubernetes topology
- Containers — Docker-level view that complements pod-level data