API Observability
The API menu is Beak's dedicated home for everything that happens at the API layer. It starts from an auto-built inventory of every API in the estate — REST, SOAP, GraphQL, gRPC, WebSocket, webhook and event APIs — and layers performance, reliability, contract, dependency, security and AI-operations views on top of that one catalogue.
Every surface reads the telemetry Beak already collects: OpenTelemetry request spans, gateway and OTel logs, Kubernetes pod logs, uploaded OpenAPI specs, the SLO runner, the deploy feed and the knowledge graph. Nothing on these screens is sample data — where a signal has not been collected yet the panel says so and names the source that fills it, rather than showing a placeholder number.
Getting APIs into the Catalogue
The catalogue is the spine of the whole menu — every other screen filters, scores or drills into it. Three actions populate it, all from the API Catalog & Discovery screen header:
- Discover — Sweeps the telemetry Beak already holds and derives APIs from it. The picker shows how much data each source holds and how much of it is HTTP-compatible, so you only scan sources that have something to find. Sources are request traces, gateway / OTel logs, Kubernetes pod logs, OpenAPI specs and service meshes.
- Import OpenAPI — Upload a spec file or paste a spec URL. This works on day one with no instrumentation at all, and gives Beak authoritative endpoint templates to match observed traffic against.
- Register API — Add a single API by hand, for something with neither telemetry nor a spec.
Catalogued records carry the attributes the rest of the menu needs: protocol, version, environment, base URL, service name, owning team or user, tier, exposure (internal / partner / public / third_party), auth method, discovery source, endpoint count, and first / last seen timestamps.
Note: Endpoint templating prefers the OpenAPI-declared template, then the
http.routespan attribute, and only then infers one. An inferred template is always shown so an operator can correct it — Beak never silently invents a route an owner would not recognise.
Two curation actions keep a large estate readable:
- Merge — Fold several discovered records into one logical API. Members keep their identity and roll up under the parent.
- Group endpoints — Label a set of endpoints so variants of the same operation report as a single row.
Command Center
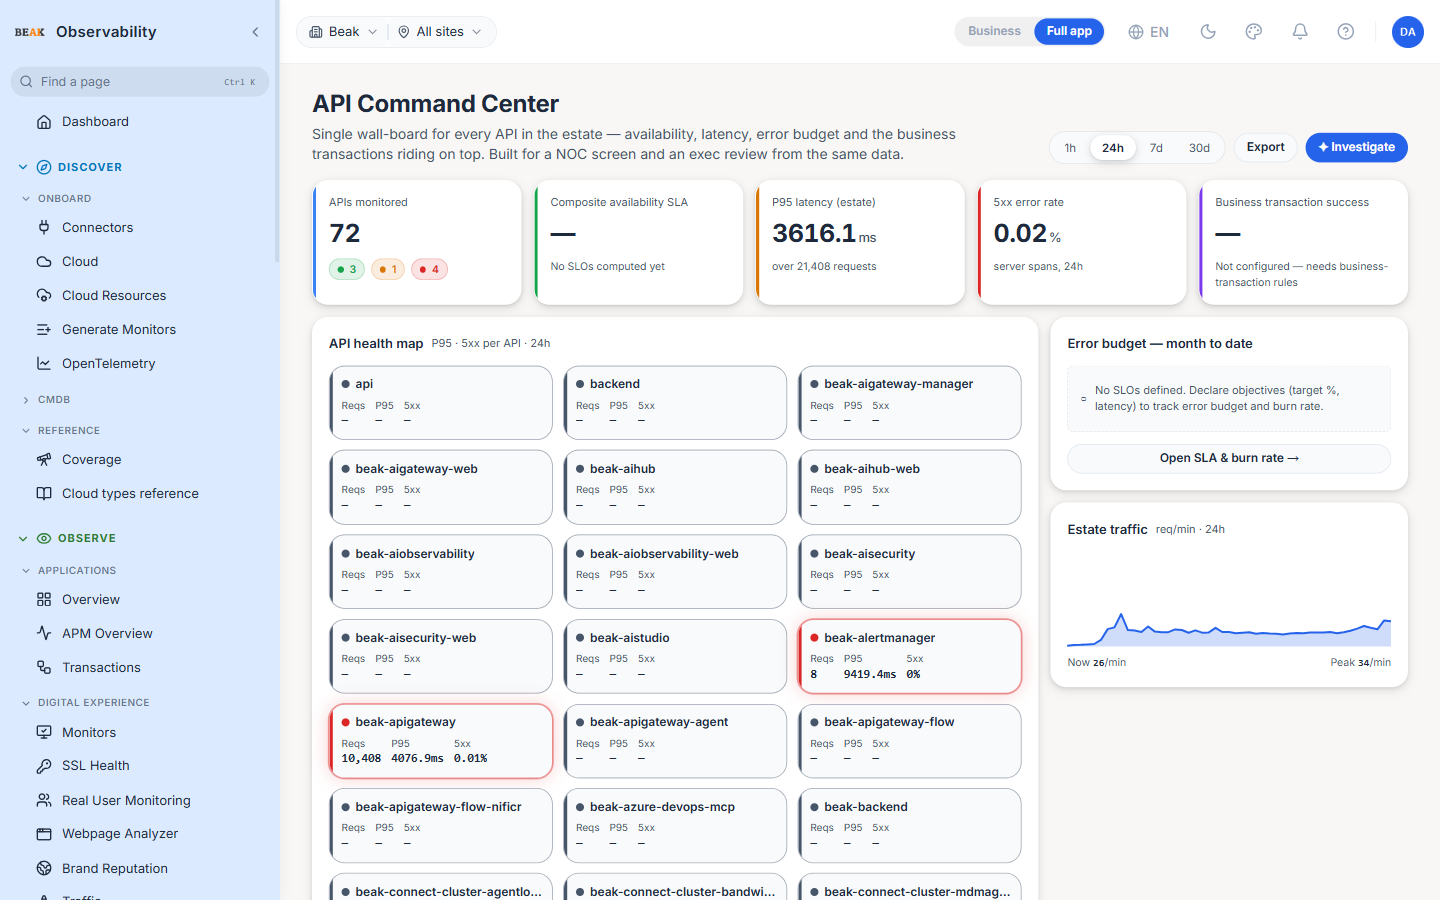
API Command Center is the wall-board — one screen that serves both a NOC display and an executive review from the same data. A time-window selector (1h, 24h, 7d, 30d) scopes the entire page, and Export writes the health map to CSV.
Five headline tiles:
- APIs monitored — Total catalogued, split into healthy / degraded / critical once telemetry exists
- Composite availability SLA — Availability across every service with an SLO defined, with the contributing SLO count
- P95 latency (estate) — Estate-wide 95th percentile for the window, with the number of requests it was computed from
- 5xx error rate — Server-side error rate across the window
- Business transaction success — Populated once business-transaction rules are configured
Below the tiles:
- API health map — One cell per API showing requests, P95 and 5xx rate, colour-banded by health; clicking a cell opens that API's detail view
- Error budget — month to date — Consumed and remaining budget with a leaderboard of the biggest consumers, and a jump to the SLA screen
- Estate traffic — Requests per minute across the window, with current and peak rates
- Active API incidents — Services currently burning their error budget, with symptom, error rate, P95 and burn-rate multiplier
- Estate P95 vs. P99 — Both curves overlaid, because the tail is usually the story
- Telemetry status — States exactly how many request spans and SLO services the board can see in the current window, so an empty panel is never ambiguous
API Catalog & Discovery
The inventory itself, with a KPI row that doubles as a set of drill-downs — clicking a tile filters the table beneath it.
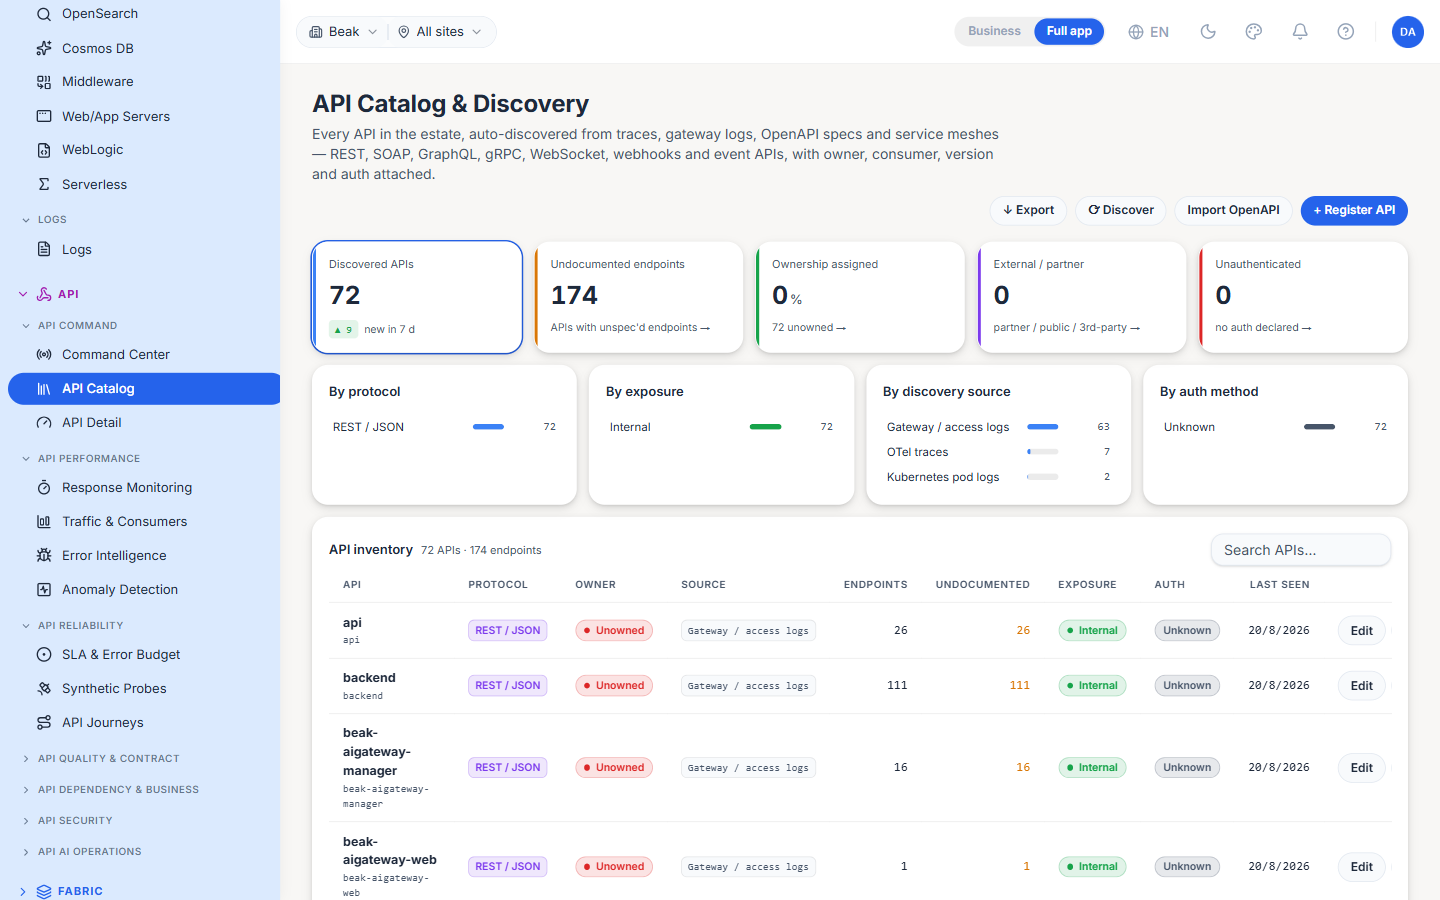
- Discovered APIs — Total in the catalogue, with the count added in the last seven days
- Undocumented endpoints — Endpoints live in production but absent from any spec
- Ownership assigned — Percentage of APIs with an owner, plus a jump to the unowned ones
- External / partner — APIs exposed beyond the internal estate
- Unauthenticated — APIs that declare no auth method at all
Four live facet cards break the estate down by protocol, by exposure, by discovery source and by auth method, and every value is clickable as a filter. The inventory table carries API, protocol, owner, source, endpoint and undocumented counts, exposure, auth and last-seen, with free-text search, pagination and CSV export.
API Detail
The per-API record: catalogue metadata (owner, exposure, auth, endpoint and undocumented counts, last seen) and the full endpoint list — endpoint, operation, whether it is documented, auth, discovery source and last seen. Where an API has been merged into another, the page says so and links to the parent.
Latency, error rate and the ten-factor health score attach to this screen with the metrics rollup phase; until then it shows the real catalogue record rather than a synthetic score.
Performance
Four screens, each scoped to one API by a picker that is deep-linkable with ?id=.
- Response Monitoring — Leads with the percentile ladder and latency distribution rather than an average, so "the API is slow" resolves into how slow, for how many callers, and on which endpoint. Includes the slowest-endpoint table and a percentile trend, computed from real request spans.
- Traffic & Consumers — Requests per minute, peak rate, top-endpoint share and active consumers, with the busiest endpoints, a traffic trend and an hour-by-day heat map. Consumer, version and region slices appear as those dimensions are collected, and are reported honestly rather than invented.
- Error Intelligence — Error rate with the 4xx / 5xx split and the endpoints actually failing, broken down by status code. An error is the OTLP error flag or an HTTP status of 400 or above.
- Anomaly Detection — A period-over-period comparison: this window against the one immediately before it, for traffic, P95 latency and error rate. The screen states how the comparison is computed rather than presenting a black-box score.
Reliability
- SLA & Error Budget — Error budget remaining, burn rate and a breach forecast per service, from the SLO runner's live burn. Objectives are operator-defined and take effect immediately; burn fills in as request telemetry flows. Includes budget-consumption charts, the SLO definition in force, and an estate-wide compliance rollup.
- Synthetic Probes — The live probe fleet from the monitors runner: probe count, availability, average response time and 24-hour fleet uptime, plus the per-probe table. These are the active checks running today; multi-region probing arrives with the distributed probe runner.
- API Journeys — Multi-step, stateful business transactions where variables from one response feed the next, reporting success at the journey level and pinpointing the step that broke. The screen documents exactly what it reports from real runs; it needs the journey runner before it populates.
Quality & Contract
- Response Quality — The gap between "responded" and "correct": schema conformance, required fields, business rules and freshness, so a fast, well-formed, wrong answer is caught rather than celebrated. Needs the response-validation engine.
- Contract Drift — The published contract versus what production actually exposes. Undocumented endpoints (live, but not in the spec) and deprecated endpoints are the real drift signal, with spec coverage and a findings table — derived from the catalogue, no traces required.
- Change Impact — Every deploy overlaid on the API's golden signals with a before / after comparison. Deploys tracked, last deploy, services and environments come from the real CI/CD deploy feed; the signal overlay and regression verdict fill in as trace metrics flow.
Dependency & Business
- Dependency Map — What this API calls and what calls it, derived from the real span tree: a caller span with a child span in another service is an edge. Shows downstream dependencies, upstream dependents and linked spans, with per-edge call volume, error rate and P95. The health-weighted graph and blast-radius view build on the same edges.
- Third-Party APIs — Every external API you depend on, with external / partner and third-party counts from the catalogue. Provider health, quota and rate-limit headroom populate once a provider registry is in place.
- Business Transactions — An API can return
200and the business outcome can still fail. This tracks outcomes — orders completed, payments settled, accounts opened — and the gap between technical and business success, from outcome events bound to span predicates.
Security
API Security Observability treats the telemetry that answers "is it fast?" as the same telemetry that answers "is it being abused?". The signal available today is exposure-based: how many APIs are catalogued, and which of them declare no authentication — the single most actionable API-security finding in most estates. Per-consumer auth abuse and behavioural profiling need auth telemetry, and the screen states that rather than drawing an empty chart.
AI Operations
- AI Investigator —
Ask Beakis live: Beak walks the knowledge graph and returns grounded, evidence-backed answers about the API estate. The automated incident causal-chain runs against a specific incident once one exists and the graph is populated. - Predict & Incidents — Predicted failures from the knowledge-graph predictor, with earliest impact, highest risk and how many predictions carry an ETA, plus SLA-trajectory and capacity-runway forecasts from the metric forecasters.
What Each Surface Needs
Every screen ships; what varies is which telemetry it is reading. This is the order that unlocks the most surfaces fastest:
- OpenAPI spec import — Populates the catalogue, endpoint templates, contract drift and spec coverage. No instrumentation required.
- OpenTelemetry request spans — Unlocks latency percentiles, error intelligence, traffic, anomaly detection and the dependency map. Point any OTel SDK or Collector at Beak's OTLP endpoint.
- SLO definitions — Unlocks availability, error budget, burn rate, breach forecast and the Command Center incident feed.
- Synthetic monitors — Unlocks the probe fleet and availability checks for APIs with no instrumentation.
- Deploy feed — Unlocks the Change Impact deploy timeline and its before / after comparison.
Access Control
Menu items are permission-scoped, so a role only sees what it is entitled to:
apis:read— Command Center, Catalog, Detail, and the performance, quality, dependency and security screensmonitors:read— Synthetic Probes and API Journeysai:use— AI Investigatorai:read— Predict & Incidents
Best Practices
- Import specs before instrumenting. A spec gives Beak authoritative endpoint templates, so when spans arrive they group correctly from the first request instead of needing correction later.
- Fix ownership first. The
Ownership assignedtile is the fastest route to an actionable estate — an alert on an unowned API has nowhere to go. - Treat
Unauthenticatedas a work queue. Every row is either a real exposure or a catalogue record to correct. - Define SLOs early. Availability, error budget, burn rate, breach forecast and the Command Center incident feed all derive from them.
- Use the window selector deliberately.
1hfor an active incident,24hfor a shift handover,7d/30dfor review — the same board serves all three. - Read the "why it is empty" notes. Each panel names the source that fills it, which turns a blank chart into a one-line onboarding task.
Related Pages
- Tracing — the OTLP trace ingest that feeds latency, error and dependency analysis
- Monitors — the synthetic monitor fleet behind Synthetic Probes
- Settings — SLO definitions, ingest pipelines and role permissions
- Knowledge Graph — the graph the AI Investigator walks
- AppManager — the wider application-monitoring surface set