Microsoft Fabric Observability
The Fabric menu is Beak's purpose-built home for Microsoft Fabric. Connect a Fabric tenant with a read-only service principal and Beak discovers your capacities, workspaces and items — data pipelines, notebooks, Spark jobs, dataflows, semantic models, lakehouses, warehouses, eventhouses, KQL databases, reports and dashboards — creates a monitor per resource, polls run and refresh history on a schedule, and alerts on failures.
Everything Fabric-specific lives here: the generic Cloud page no longer offers Fabric as a connectable provider. The menu reads top-to-bottom as an operator would work it — fleet health, then what needs attention, then a launchpad into each specialised slice.
Prerequisites
Beak authenticates to Fabric as an Entra ID service principal (SP) and only ever reads — no Fabric API call Beak makes mutates state. The SP's client secret is encrypted at rest and is not retrievable from the UI once entered.
Two access models are supported, and Beak detects which one it has on every sync:
- Tenant-wide (Option A) — The SP may call the read-only admin APIs. Discovery walks the entire tenant in three calls and sees everything, including capacities, gateways and activity logs.
- Workspace-scoped (Option B, least privilege) — The SP is added as
Vieweron each workspace you want monitored, and nothing more. Discovery enumerates only those workspaces and their items.
Option B is the smaller ask and the one most customers approve. Its only trade-off is coverage: on-premises gateway health and Power BI activity logs are admin-only surfaces with no workspace-scoped equivalent, and a workspace the SP was not added to is invisible.
What the Fabric administrator grants:
- App registration with a client secret — Required for both options. Hand
tenant_id,client_idandclient_secretto whoever connects the account in Beak. - Service principals can use Fabric APIs — Fabric admin portal tenant setting, applied to a security group containing the SP. Mandatory for both options.
Tenant.Read.All(Power BI Service, Application) with admin consent — Option A only.- Service principals can access read-only admin APIs — Option A only. This is a second, separate tenant setting in the same Developer settings panel; enabling only the first one and expecting tenant-wide discovery is the most common onboarding mistake.
- Workspace
Viewer— Option B's core grant, and on Option A the way to unlock per-item data-plane probes.
Note: Allow roughly fifteen minutes for Fabric tenant-setting propagation before the first sync is expected to succeed.
Optional grants unlock deeper surfaces and are covered in Access and capability map. Beak degrades cleanly when one is missing — the affected probe reports a descriptive error and the screen states which grant fills it, never a cascading failure.
Fabric Overview
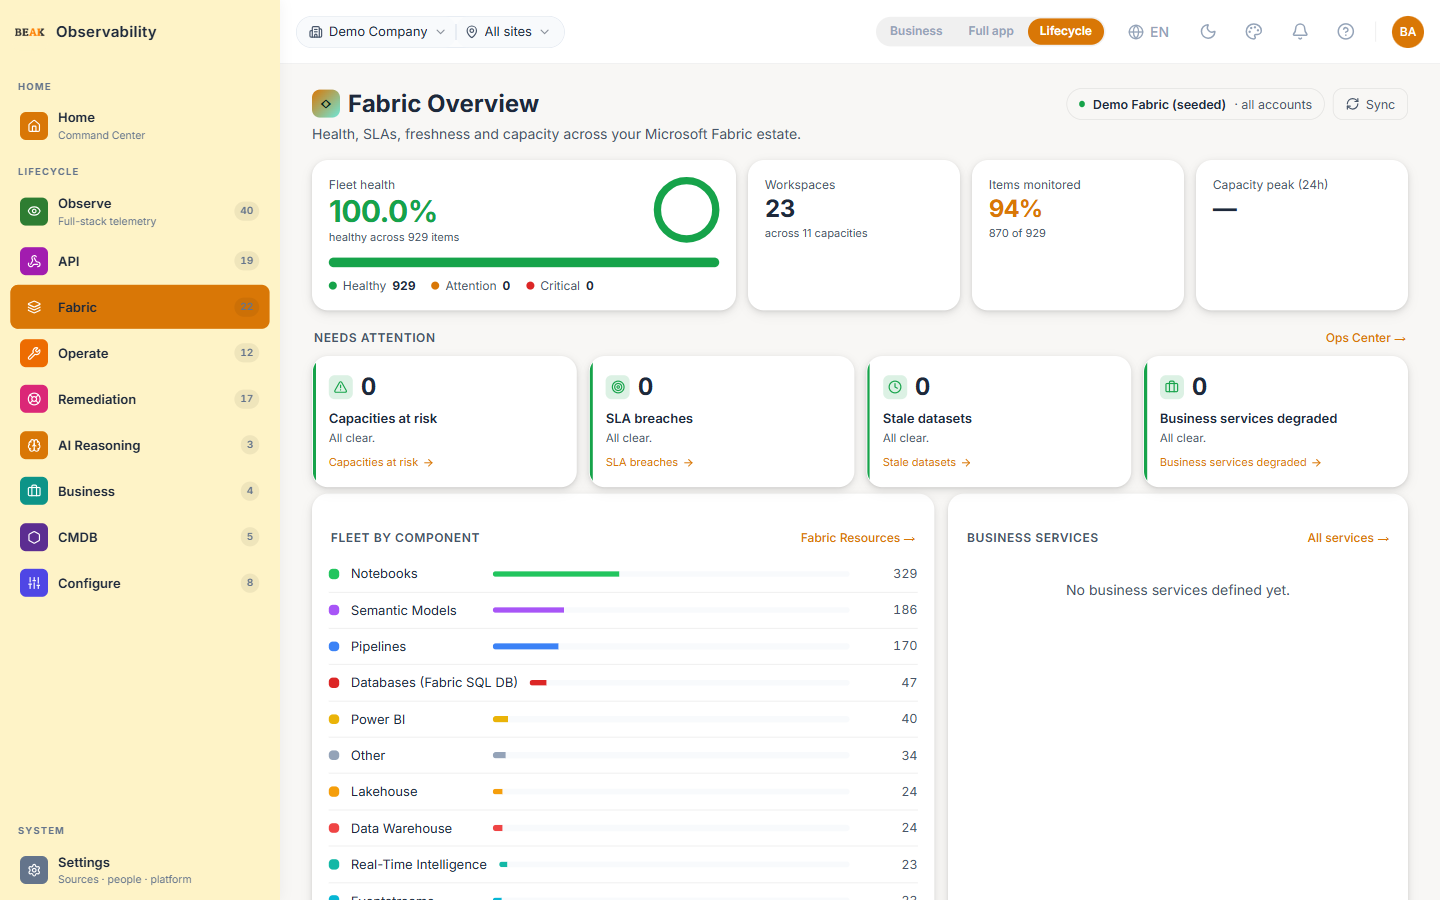
The command center for the estate, and the menu's landing page. It reads in four bands:
- Fleet health — Healthy / attention / critical across every monitored Fabric item, with the healthy count over the total
- Workspaces — Workspace count, across how many capacities
- Items monitored — How many discovered items have a monitor attached, out of the total
- Capacity peak (24h) — The highest capacity utilisation seen in the last day
Below the tiles:
- Needs attention — Capacities at risk, SLA breaches, stale datasets and degraded business services, each linking to the slice that explains it. Shows
All clear.when there is nothing to act on. - Fleet by component — The estate bucketed into Fabric components, with a jump to Fabric Resources
- Business services — Health of the named services you have defined, with a jump to the full list
- Explore — A launchpad tile for every Fabric slice, so the whole menu is discoverable from one screen
When no Fabric account is connected the page says so and offers Connect Fabric account rather than rendering empty panels.
Fabric Accounts
Connect and manage the Microsoft Fabric tenants Beak monitors. Each account runs the full lifecycle — connect with the service-principal credentials, sync inventory, drill into a per-account overview and resource list, and delete when it is no longer needed. Every account discovers its own workspaces, capacities and items.
Sync runs hourly by default. On Option A it covers the whole tenant; on Option B it covers exactly the workspaces the SP was added to, which makes the account page the place to verify that granted coverage matches intended coverage.
Fabric Resources
Every discovered Fabric item across all connected accounts, organised by Fabric component rather than by generic cloud category. The All tab is the aggregate overview; each component tab scopes tiles, charts, counts, filters and the table to that component. A workspace filter in the toolbar is Fabric's equivalent of a resource group and applies across every tab.
The component taxonomy is:
- Data Factory and Pipelines — Orchestration and data movement
- Lakehouse, Data Warehouse and Databases (Fabric SQL DB) — Storage and query engines
- Data Engineering and Notebooks — Spark and notebook workloads
- Data Science — Model and experiment items
- Power BI and Semantic Models — Reporting and the models behind it
- Real-Time Intelligence, Eventstreams and KQL Database — Streaming and real-time analytics
- Mirroring — Mirrored database items
- Other — Anything outside the taxonomy above
Monitors
Every monitor tied to a Fabric account, in one Fabric-scoped view — the main Monitors page stays global across all providers. Columns are Fabric-shaped (component, workspace, capacity) rather than generic cloud ones (region, subscription): status, monitor, component, workspace, capacity, interval and last check.
The view is server-side paginated with search, per-column filter and sort, a column picker, CSV / PDF export and bulk pause / resume, so it stays usable at tens of thousands of monitors.
Data Pipelines
The operator's "is everything OK right now?" view for Fabric data pipelines. Every figure comes from monitor checks, pipeline runs and item schedules — nothing on this page is a placeholder.
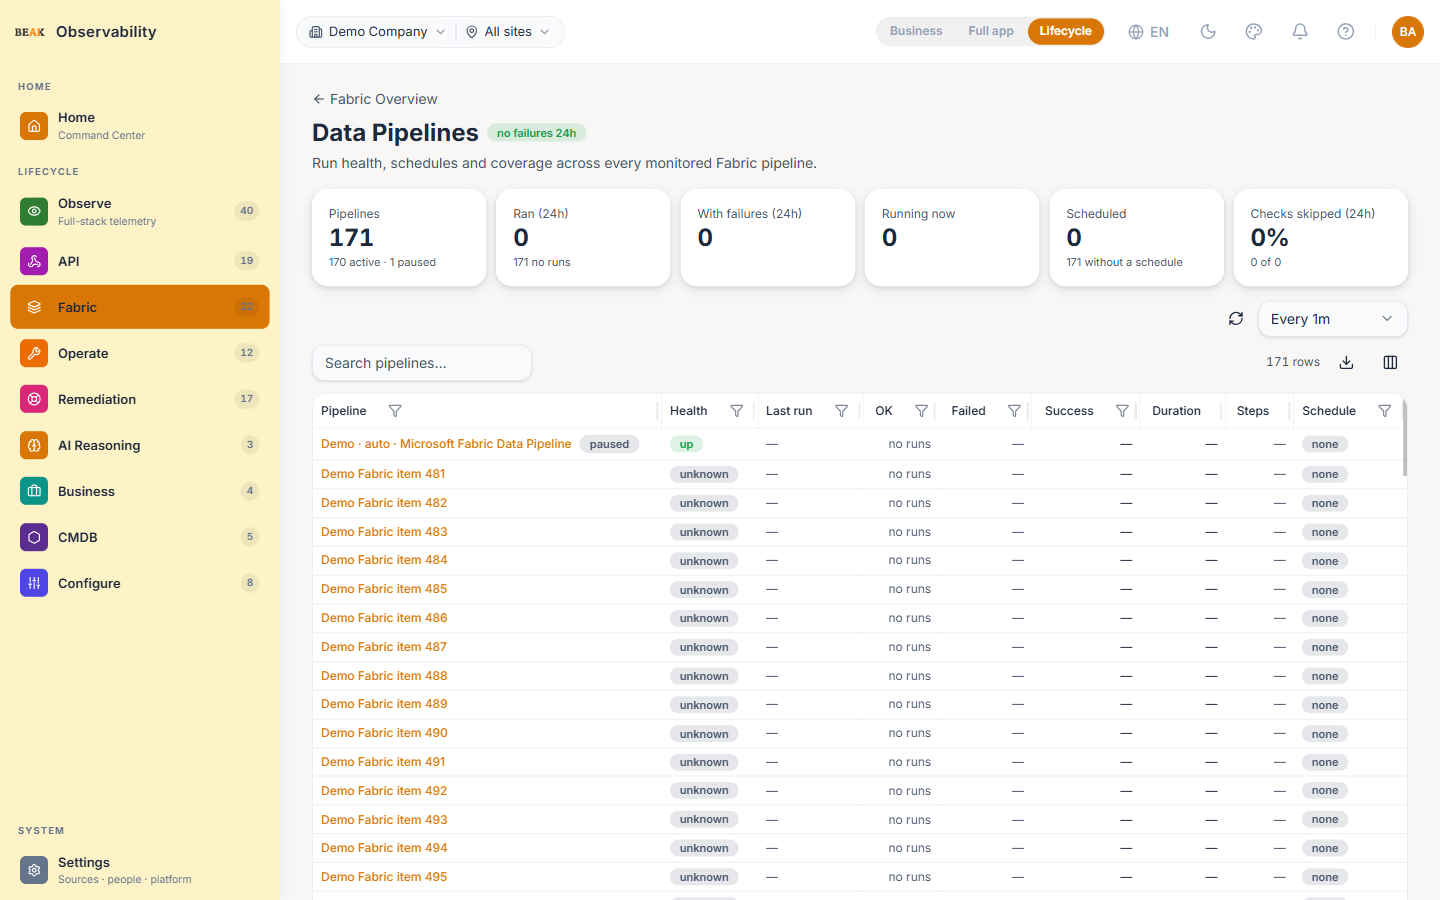
- Pipelines — Total, split active / paused
- Ran (24h) — How many ran, and how many had no runs at all
- With failures (24h) — Pipelines with at least one failed run
- Running now — Currently executing
- Scheduled — How many have a schedule, and how many have none
- Checks skipped (24h) — The share of checks Beak deliberately skipped to stay inside Fabric's per-tenant API limit
The table adds last run, OK and failed counts, success rate, duration, step count, schedule and cadence, with search, filters, sort, a column picker and export.
Three presentation rules are deliberate, because the opposite shipped as a bug once:
- A pipeline with no runs reads
no runs— never0%and never a green tick - A throttled check is reported as Beak's skipped collection — never as the pipeline being unavailable
no scheduleis an explicit unknown — not "nothing missed"
Note: Probe intervals are derived from each pipeline's own cadence to keep Fabric API spend down, so a high skipped-check percentage is a collection gap on Beak's side, not a fleet outage. The page states this in-line whenever it exceeds a quarter of checks.
Business Services
Named dependency chains of Fabric items, monitored as one unit — group the pipeline, notebook, dataflow, lakehouse, warehouse and semantic model behind "Monthly Payroll" and monitor the outcome rather than six unrelated rows.
- Create a service — Name it and pick members by item type
- Suggest — Beak proposes candidate services grouped by lineage where available, otherwise by workspace; review and add individually or all at once
- Health rollup — Each service reports
Healthy,Degraded,DownorUnknown, with a member breakdown of total / failing / degraded
Data Freshness
How stale each semantic model is, and whether its last refresh failed. Datasets are banded Fresh, Stale, Failing or Unknown, with last refresh time, last status and the summary counts per band. Models that have never refreshed are labelled as such rather than counted as fresh.
Data SLA
24-hour success-rate attainment for scheduled Fabric workloads — pipelines, notebooks, Spark jobs, dataflows and semantic models. Each workload shows its type, 24-hour attainment, band (Met, At risk, Breached, Unknown) and target.
Targets are editable per workload and override the tenant default; the reliability evaluator raises an incident when a workload drops below its target. Clearing a target falls back to the tenant default.
Capacity Intelligence
Utilisation trend, exhaustion forecast and a scaling recommendation per capacity — current utilisation, trend, forecast peak, time-to-throttle and throttling events in the last 24 hours, with a recommendation such as Scale F16 → F32 or hold.
Note: Utilisation, trend and recommendations need capacity unit metrics from the Fabric Capacity Metrics app or CPU metrics from Azure Monitor on the capacity. Without either grant only lifecycle state is collected, and the page says so — the columns populate automatically once access is granted, with no redeploy.
Ops Center
One aggregated board across the estate: services down and degraded out of the total, SLA breached and at risk, datasets failing and stale, and capacities at risk out of the total. It is the single screen to keep open during a data-platform incident.
Lineage Health
The data-flow lineage graph — feeds and powers edges — across your business services, so you can see which report loses data when an upstream pipeline fails. Needs Scanner-API lineage (admin) plus business services with member items; until both exist the page states exactly that instead of drawing an empty canvas.
AI Root Cause
Pick a failing item and Beak traces its causal chain, evidence-first, from real lineage and health rather than a generic template. The screen lists what is failing now, then for the selected item shows the causal chain, the likely root cause and its upstream dependencies. When nothing is breaching its SLA it says so.
Ops Copilot
Ask about the Fabric estate and get answers computed from live monitoring data, not from a model's recollection. Guided questions cover the four questions operators actually ask:
- Which datasets are stale or failing?
- What is breaching its SLA?
- Which capacities are under pressure?
- Which business services are unhealthy?
Each answer resolves against current data, including the negative case (All datasets are fresh.). Free-form natural-language queries are a planned enhancement.
Knowledge Graph
Business services and their member items across the estate, as an interactive graph rooted at Fabric estate. Click a node for its properties, and use the chips to drill into a branch. The graph fills in as topology syncs and business services are defined; tenant-wide lineage also needs the Scanner API.
Workspace Governance
Governance hygiene across your Fabric workspaces, scored out of 100 with the findings that drove the score:
- Not on a capacity — Workspaces with no capacity assignment
- Empty workspaces — Provisioned but holding nothing
- Inactive workspaces — Abandoned or stopped
The table ranks workspaces by risk (High, Medium, Low, OK) with findings, item count, capacity and state. This surface works on the mandatory grants alone; owner and permission signals need the Scanner API.
Change Intelligence
Who changed, ran and viewed what across the estate, from admin activity events. Change operations — create, update, delete, deploy, rename — are called out from the run and view noise, so a "what changed just before this broke?" question has a single answer.
- Changes — Change operations in the window
- Total activity — All activity events
- Active users — Distinct users
- Workspaces touched — Distinct workspaces
The event table carries when, operation, item, user and workspace. Needs admin activity events (Tenant.Read.All plus the read-only admin APIs setting).
Semantic Model Intelligence
Refresh reliability and freshness for every semantic model, with 24-hour attainment and the last failure reason. Row health rolls up from cached refresh checks, so opening the page makes no calls to Microsoft.
- Semantic models — Total discovered
- Fresh / Attention / Stale — Freshness banding across the fleet
- Refresh failures (24h) — Total failed refreshes
The table lists model, last refresh, freshness band, 24-hour OK / fail counts, SLA attainment and last failure reason. When refresh telemetry covers less than half the discovered models the page states the covered fraction and the grant that widens it, rather than reporting the rest as healthy. Per-model dataset size, memory footprint and refresh-duration trend need DMV / XMLA access and are called out as deferred.
Query Performance
Engine health across Fabric SQL endpoints, KQL databases and capacities — average query duration, active and queued requests, and failed queries in the last hour, plus a per-endpoint table with the longest-running snapshot. Read from cached probe checks, with no calls to Microsoft on page load.
When no query telemetry has been reported the page says so and names the three sources that fill it: the SQL DMV probe, KQL query stats and the Capacity Metrics app. Per-query text and duration need a per-query harvest and are flagged as a follow-up.
Notebook Observability
Run reliability per notebook, from cached run checks — attainment, OK and failed counts over 24 hours, and the last failure reason, alongside the notebook total from the resource summary. Spark stage detail, executor usage and per-run traces need Spark / Livy monitoring and are called out as a follow-up.
Access-Gated Surfaces
Three screens are built and wired but data-gated: they need a Microsoft grant that most tenants have not made on day one. Rather than showing invented numbers, each states which grant unlocks it and exactly what it will show. They light up automatically once the grant lands and probes start writing checks — no redeploy.
- AI Capacity Optimization — Idle or under-used capacities with a target SKU, zombie items that cost capacity but have no runs or views, wasteful refresh schedules and an estimated monthly saving. Needs the Capacity Metrics app (CU per item).
- AI Cost Optimization — Capacity cost allocated to items by their share of CU consumption, rolled up to workspace, owner and department for chargeback or showback, with top cost drivers and month-over-month trend. Needs the Capacity Metrics app (per-item CU allocation).
- Power BI Experience Monitoring — Dashboard load and per-visual render times, the slowest visuals, DAX execution time, concurrent users, and failures by browser and geography. Needs Workspace Monitoring, enabled per workspace by the customer.
Access and Capability Map
Which capability needs which grant. Everything in the mandatory tier works on any connected tenant; the rest are data-gated and populate automatically when the grant is in place.
- Mandatory grants only — Inventory, hierarchy, fleet health, Workspace Governance, alerting, business services, Data Freshness, Data SLA and run-health alerts
- Admin activity events — Change Intelligence
- Capacity Metrics app, or Azure Monitor
Monitoring Reader— Capacity Intelligence utilisation and forecast, AI Capacity Optimization, AI Cost Optimization - Scanner API lineage (admin) — Lineage Health per hop, AI Root Cause causal chains, lineage-based business-service suggestions
- Workspace
Viewerplus DMV / XMLA — Semantic Model Intelligence depth, Query Performance Observatory - Spark / Livy monitoring — Notebook Observability Spark detail
- Workspace Monitoring — Power BI Experience Monitoring
To unlock the most capability for the least effort, grant in this order: the Capacity Metrics app first (it unlocks utilisation, forecasting, capacity optimisation and cost chargeback in one step), then the read-only admin APIs plus a completed admin scan for real lineage and RCA depth, then workspace Viewer on the workspaces you care about.
Best Practices
- Start with Option B. Workspace-scoped
Vieweraccess is the smaller ask, it gets you all inventory and run history, and you can widen to tenant-wide later without reconnecting. - Verify coverage after the first sync. On Option B, compare the discovered workspace list against the workspaces you intended to grant — anything missed is invisible rather than reported as healthy.
- Define business services early. Almost every rollup, RCA chain and copilot answer gets sharper once Beak knows which items belong to the same outcome. Use
Suggestfor the first pass. - Set SLA targets per workload, not globally. A nightly reporting pipeline and an hourly ingestion pipeline should not share one attainment target.
- Read the skipped-checks tile as spend, not failure. It reflects Beak staying inside Fabric's API limit; if you need tighter coverage, that is a probe-interval conversation.
- Treat the access-gated screens as an onboarding checklist. Each one names the grant that lights it up, and none of them need a redeploy afterwards.
Related Pages
- Cloud — the shared account, sync and resource-drilldown engine Fabric Accounts reuses
- Monitors — the global monitor fleet across every provider
- Alerts — where Fabric run and refresh failures surface as alerts
- Knowledge Graph — the cross-layer graph Fabric topology feeds
- Logs — where Fabric activity events land as searchable logs