Tracing
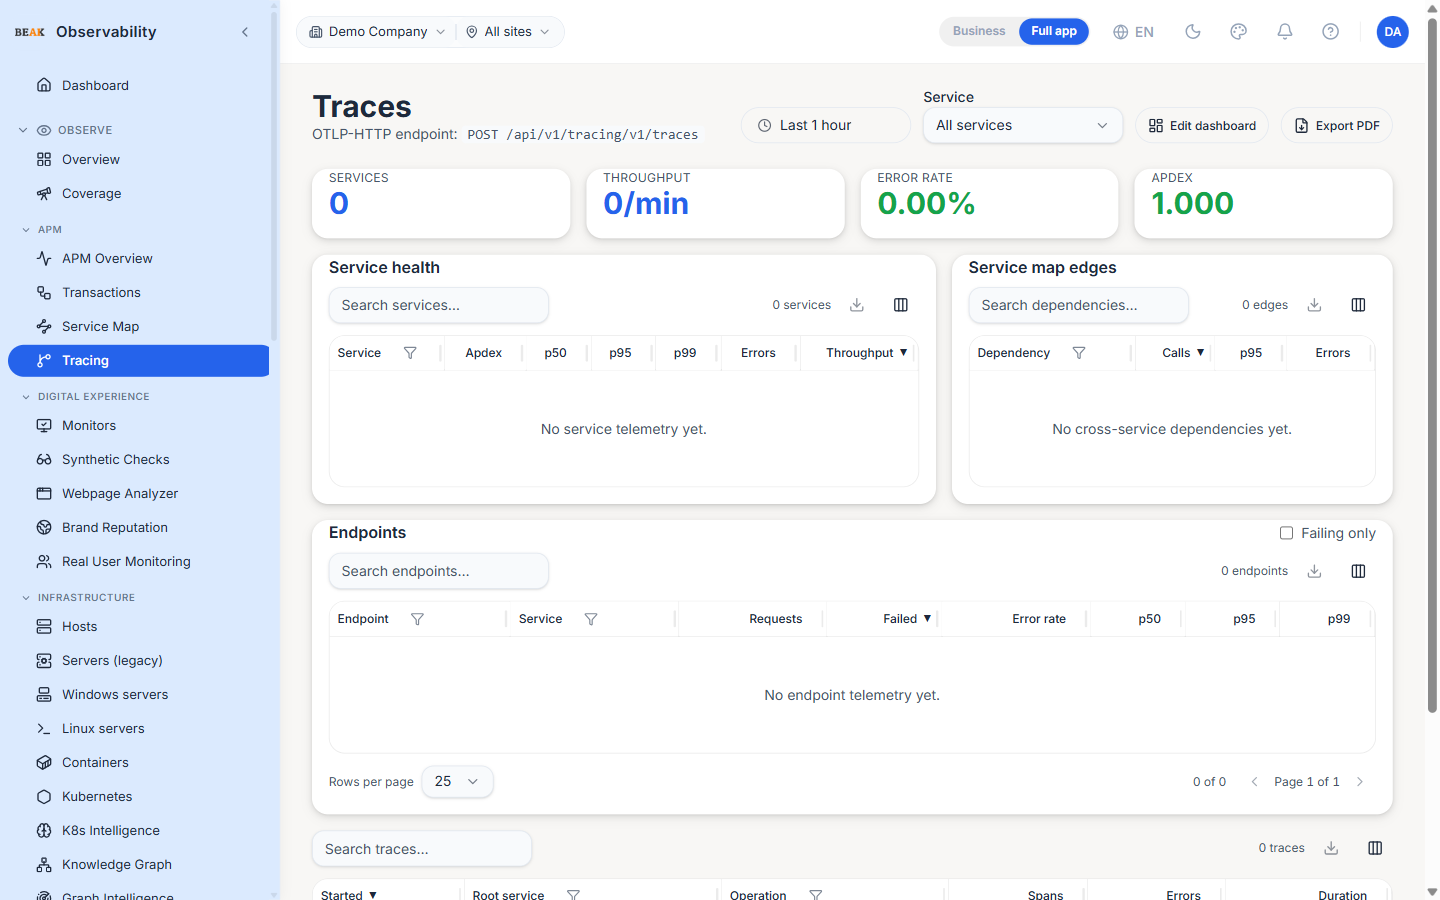
The Tracing surface (/tracing, rendered with the heading "Traces") surfaces distributed traces ingested through the platform's OTLP-HTTP endpoint. It rolls every trace up into service-level health, cross-service dependency edges, and a searchable list of recent traces. Drilling into any trace opens the span-level waterfall.
OTLP Endpoint
Point any OpenTelemetry SDK or Collector at:
POST /api/v1/tracing/v1/traces
The endpoint accepts OTLP-JSON; spans are persisted and rolled up into the service summary on every refresh.
Service Filter
The Service dropdown in the header narrows every panel and the trace list to a single service. All services (the default) shows the tenant-wide rollup.
KPI Tiles
Four headline metrics summarise the last hour:
- Services — Distinct services reporting at least one span
- Throughput — Span ingest rate per minute across all services in the window
- Error rate —
errors / spansas a percentage; turns red above 1 percent - Apdex — Span-weighted Apdex score across all services; turns amber below 0.85
Service Health Table
Per-service breakdown of latency and error metrics:
| Column | Description |
|---|---|
| Service | Service name as declared by the SDK's resource attributes |
| Apdex | Per-service Apdex score (higher is better, 1.0 is perfect) |
| p50 | Median span duration in milliseconds |
| p95 | 95th-percentile span duration in milliseconds |
| p99 | 99th-percentile span duration in milliseconds |
| Errors | Error rate as a percentage of spans |
| Throughput | Spans per minute |
Service Map Edges
Every cross-service call extracted from spans is rolled up into one row. The map shows the calling service, the callee, the call count, the p95 latency for that edge, and the error rate.
This view answers "which dependency is slow" without having to render a graph.
Endpoints
A per-endpoint breakdown of request volume, failures and latency. Toggle Failing only to restrict the table to endpoints currently returning errors. Columns:
- Endpoint — Operation / route name
- Service — Owning service
- Requests — Request count in the window
- Failed — Failed request count
- Error rate —
failed / requestsas a percentage - p50 / p95 / p99 — Latency percentiles in milliseconds
Recent Traces
The bottom table lists the most recent traces (newest first). Columns:
- Started — Relative time since the trace started
- Root service — Service that emitted the root span
- Operation — Root span name; clicking opens the trace detail view
- Spans — Total span count in the trace
- Errors — Span error count (a red badge appears when non-zero)
- Duration — End-to-end trace duration
Trace Detail
Clicking a trace opens the waterfall view — every span ordered by start time, indented by parent, with hover tooltips for the span attributes. Use this to find the slow span or the span that raised the error.
Best Practices
- Set the SDK's
service.nameresource attribute consistently across deploys — the Service Health rollup is keyed off it. - Sample selectively in high-throughput services (e.g. head-based sampling at 10 percent) to keep storage and ingest cost predictable while preserving every error span.
- Use the service filter when triaging a customer-reported issue — the All Services view is noisier than per-service when investigating a single user journey.
- The Apdex threshold can be tuned per service in the Settings section if 0.85 doesn't match the team's SLOs.