Screen Time
Employee Screen Time Analytics (Screen Time) is the per-employee detail view that complements the team and department roll-ups. It shows total screen time, average daily hours, the most active day, and a sortable employee table with productive/idle splits.
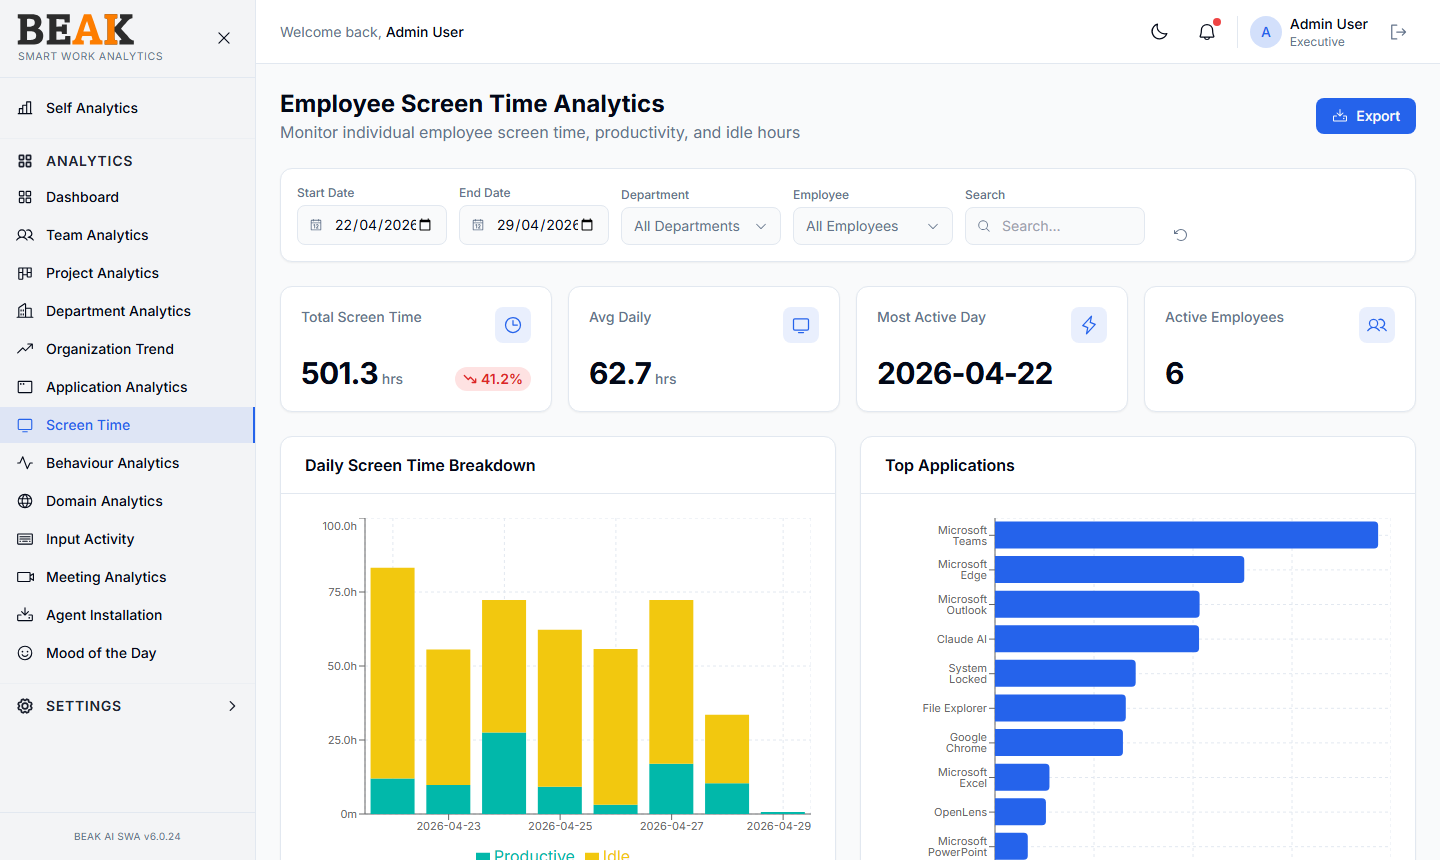
Filters
- Start Date / End Date — Period under analysis
- Department — Filter to a single department, or
All Departments - Employee — Filter to a single employee, or
All Employees - Search — Free-text search by name or email
- Reset — Circular arrow icon
- Export — Download the employee table as CSV
Summary Tiles
- Total Screen Time — Total active screen time across the filtered scope, with a delta vs the previous period
- Avg Daily — Average hours per active day across the scope
- Most Active Day — Calendar date with the highest captured screen time in the period
- Active Employees — Distinct employees with at least one minute of activity
Daily Screen Time Breakdown
A stacked bar chart showing productive (green) and idle (yellow) hours per day for the filtered scope. The single most useful chart for spotting "the team is working long hours but mostly idle" patterns.
Top Applications
A bar chart ranking applications by total hours within the filtered scope — defaults align with Application Analytics for consistent app rankings.
Employee Screen Time
A sortable, paginated table:
| Column | Description |
|---|---|
| Employee | Employee name and avatar |
| Department | Department from the user record |
| Total Hours | Total active screen time |
| Productive | Productive hours |
| Idle | Idle hours |
| Productive % | Productive / (Productive + Unproductive) |
Click any column header to sort. Use the Search field to find a specific employee in a large fleet.
Best Practices
- Use
Avg Dailyrather thanTotal Screen Timewhen comparing employees on different schedules — total hours penalizes anyone with PTO during the window. - A high
Total Hourswith lowProductive %is the strongest signal for an HR conversation about work patterns or category misclassification. - When investigating overtime concerns, pair this view with Behaviour Analytics which surfaces the overtime % directly.
- Use
Exportto send the table to managers for the weekly 1:1.
Related Pages
- Behaviour Analytics — Login and overtime patterns
- Application Analytics — Application detail
- Team Analytics — Team-level rollup
- Categories — Adjust productivity classifications