Input Activity
Input Activity (page heading: Input Pulse) shows aggregate keyboard and mouse activity captured by the SWA agent. The view emphasizes that counts only are recorded — there is no keylogging and no captured content.
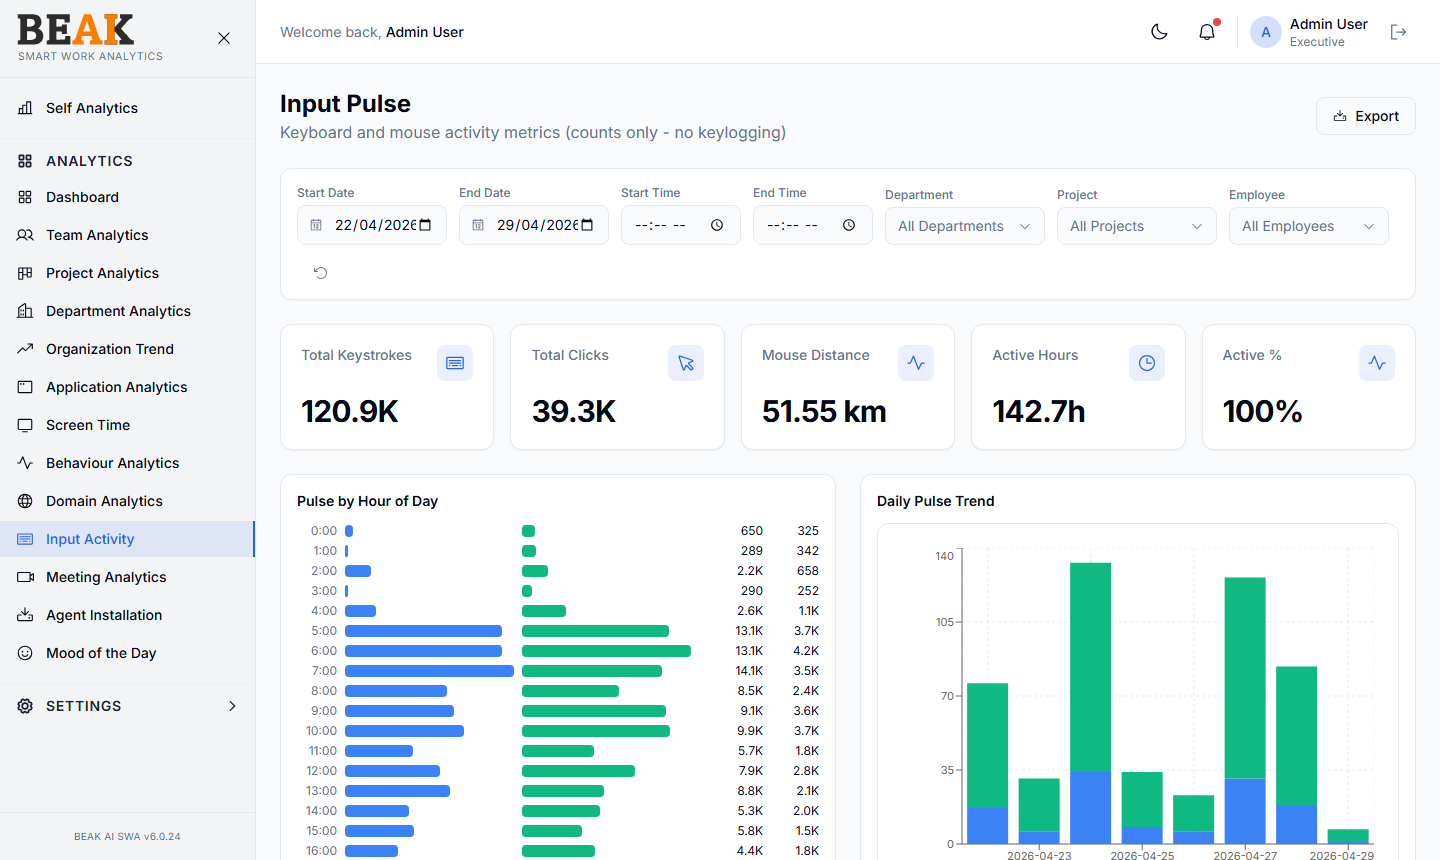
Note: SWA records keystroke and click counts per hour, not the keys pressed or the content typed. Mouse distance is computed from cursor pixel deltas. No screen content, clipboard data, or text is recorded.
Filters
- Start Date / End Date / Start Time / End Time — Period under analysis
- Department — Filter to a single department, or
All Departments - Project — Filter to a single project, or
All Projects - Employee — Filter to a single employee, or
All Employees - Reset — Circular arrow icon
- Export — Download the breakdown as CSV
Summary Tiles
- Total Keystrokes — Aggregate keystroke count for the filtered scope
- Total Clicks — Aggregate mouse click count
- Mouse Distance — Total cursor distance traveled (e.g.
51.52 km) - Active Hours — Total hours with at least one input event
- Active % — Share of screen time that registered input activity
Charts
Pulse by Hour of Day
A horizontal bar chart with two series per hour — clicks (blue) and keystrokes (green). Numbers on the right are the absolute counts for each hour bucket. Use this to see when in the day input activity peaks — useful for sizing focus windows and planning meeting-free blocks.
Daily Pulse Trend
A stacked bar chart of clicks and keystrokes per day across the window. Use this to spot anomalies — e.g. a sudden drop in keystrokes despite high screen time may indicate the user moved to a different device or activity not captured by SWA.
Best Practices
- Treat input activity as a liveness signal, not a productivity score — designers and reviewers may have low input activity yet be productive.
- Use the
Pulse by Hour of Daychart to identify quiet windows for company-wide deploys, maintenance, or focus time. - Pair input activity with Application Analytics — high input activity in
Communicationapps but low input activity inDevelopmentapps tells a clear story about where time is going.
Related Pages
- Application Analytics — Application usage
- Screen Time — Per-employee screen time
- Self Analytics — Personal input analytics