Domain Analytics
Domain Analytics is the website counterpart to Application Analytics. It surfaces every domain captured by the SWA agent, classifies it by Domain Categories, and ranks domains by usage hours.
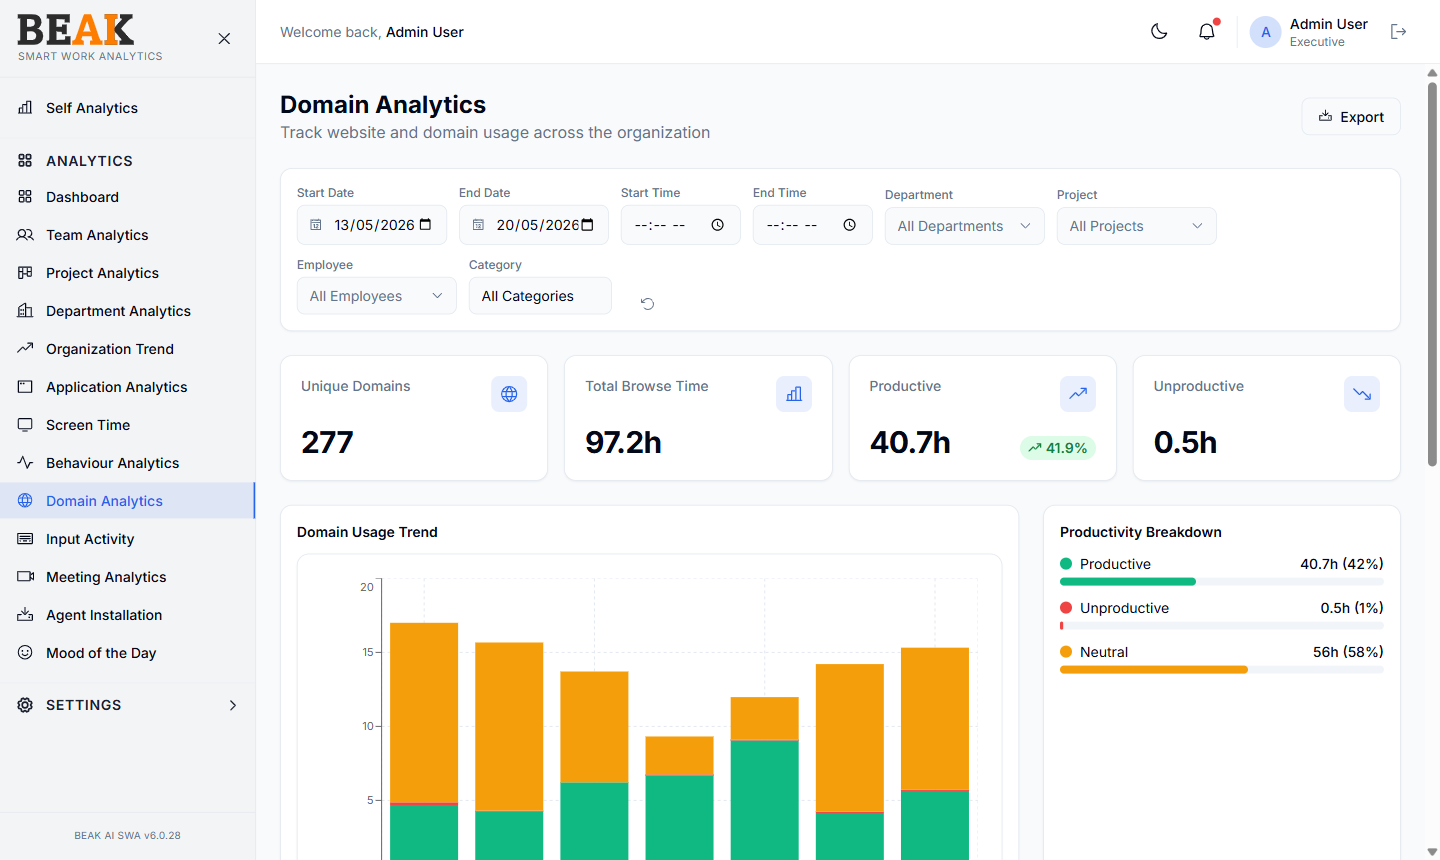
Filters
- Start Date / End Date / Start Time / End Time — Period under analysis
- Department — Filter to a single department, or
All Departments - Project — Filter to a single project, or
All Projects - Employee — Filter to a single employee, or
All Employees - Category — Filter to a single Domain Category, or
All Categories - Reset — Circular arrow icon
- Export — Download the domain grid as CSV
Summary Tiles
Four tiles summarise the period at the top of the page:
- Unique Domains — Distinct domains captured across all users in the window
- Total Browse Time — Total hours across all domains
- Productive — Hours classified as productive, with a delta % vs the previous matching period
- Unproductive — Hours classified as unproductive
Charts
Domain Usage Trend
A stacked bar chart per day showing three series — Productive, Unproductive, and Neutral hours. Use this to confirm whether an unproductive spike is from a particular day or a sustained pattern.
Productivity Breakdown
A horizontal bar list showing the share of domain time across Productive, Unproductive, and Neutral classifications, each with absolute hours and a % of total.
Domain Grid
A sortable, paginated table:
| Column | Description |
|---|---|
| Domain | The domain name (e.g. github.com, youtube.com) |
| Hours | Total time spent on the domain in the period |
| Productivity | Productive / Neutral / Unproductive flag |
| Category | The mapped domain category |
Pagination controls (First, Prev, Next, Last) navigate large lists.
Best Practices
- Recurring domains showing as
Uncategorizedshould be classified in Domain Categories so they roll up correctly into productivity buckets. - For a fleet-wide policy decision (e.g. "should we block social media"), run with
All Departmentsand sort byHoursto see the realistic exposure. - Use the
Departmentfilter to compare web habits across teams — sales teams may legitimately spend more time on LinkedIn than engineering.
Related Pages
- Domain Categories — Classify domains
- Application Analytics — Application counterpart
- Categories — Productivity category configuration