Mood of the Day
MOD Analytics (Mood of the Day) is BEAK SWA's employee sentiment view. Users can submit a daily mood signal from the SWA agent, and this page rolls those signals up to give HR and managers an early read on team morale — alongside the productivity data on every other page.
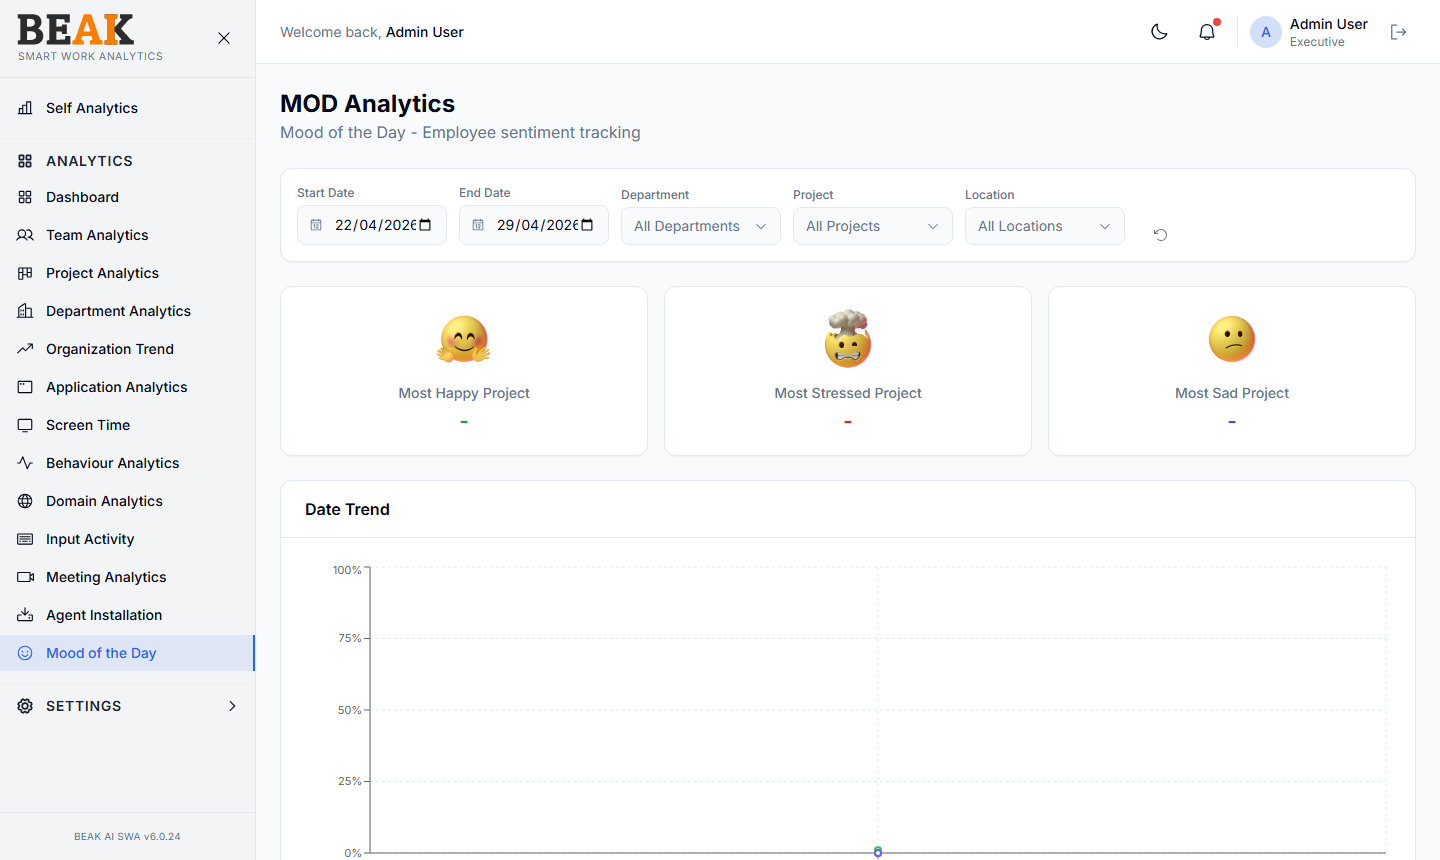
Filters
- Start Date / End Date — Period under analysis
- Department — Filter to a single department, or
All Departments - Project — Filter to a single project, or
All Projects - Location — Filter to a single location, or
All Locations
Summary Tiles
Three header tiles call out extremes for the filtered scope:
- Most Happy Project — Project with the highest share of happy mood submissions
- Most Stressed Project — Project with the highest share of stressed mood submissions
- Most Sad Project — Project with the highest share of sad mood submissions
These cards are the fastest read on which projects deserve a manager check-in.
Charts
Date Trend
A line chart showing the percentage of each mood category submitted per day across the window. Use this to spot inflection points — e.g. a stress spike that aligns with a release week, or a happiness dip that aligns with a reorg.
Mood by Location
A bar chart breaking down mood by location. Useful for hybrid organizations to compare WFH vs office sentiment.
Mood by Department
A bar chart of mood per department — the canonical HR view.
Mood by Project
A bar chart of mood per project. Combined with Project Analytics, this view often reveals when a long-running project is wearing down its team.
Best Practices
- Pair
Mood of the Daywith Behaviour Analytics — sustained overtime % and rising stress mood is the most reliable burnout signal SWA surfaces. - Mood data is opt-in per submission — a low submission count is not necessarily bad sentiment, but it does limit the chart's significance. Set a target submission rate and track it in
Date Trend. - Use
Locationfilter for hybrid pilots — a sustained mood gap between WFH and office is a strong input to RTO debates. - Don't over-aggregate — a department with 5 stressed submissions out of 100 is very different from one with 50 out of 100. Hover the bar segments for raw counts.
Related Pages
- Behaviour Analytics — Login trends and overtime
- Project Analytics — Per-project drilldown
- Department Analytics — Department comparison