Behaviour Analytics
Behaviour Analytics focuses on how people are working rather than how much — login cadence, overtime burn, and the balance between productive and non-productive time. It's the view HR managers reach for when trying to spot burnout, attrition, or shift-pattern issues before they become attrition.
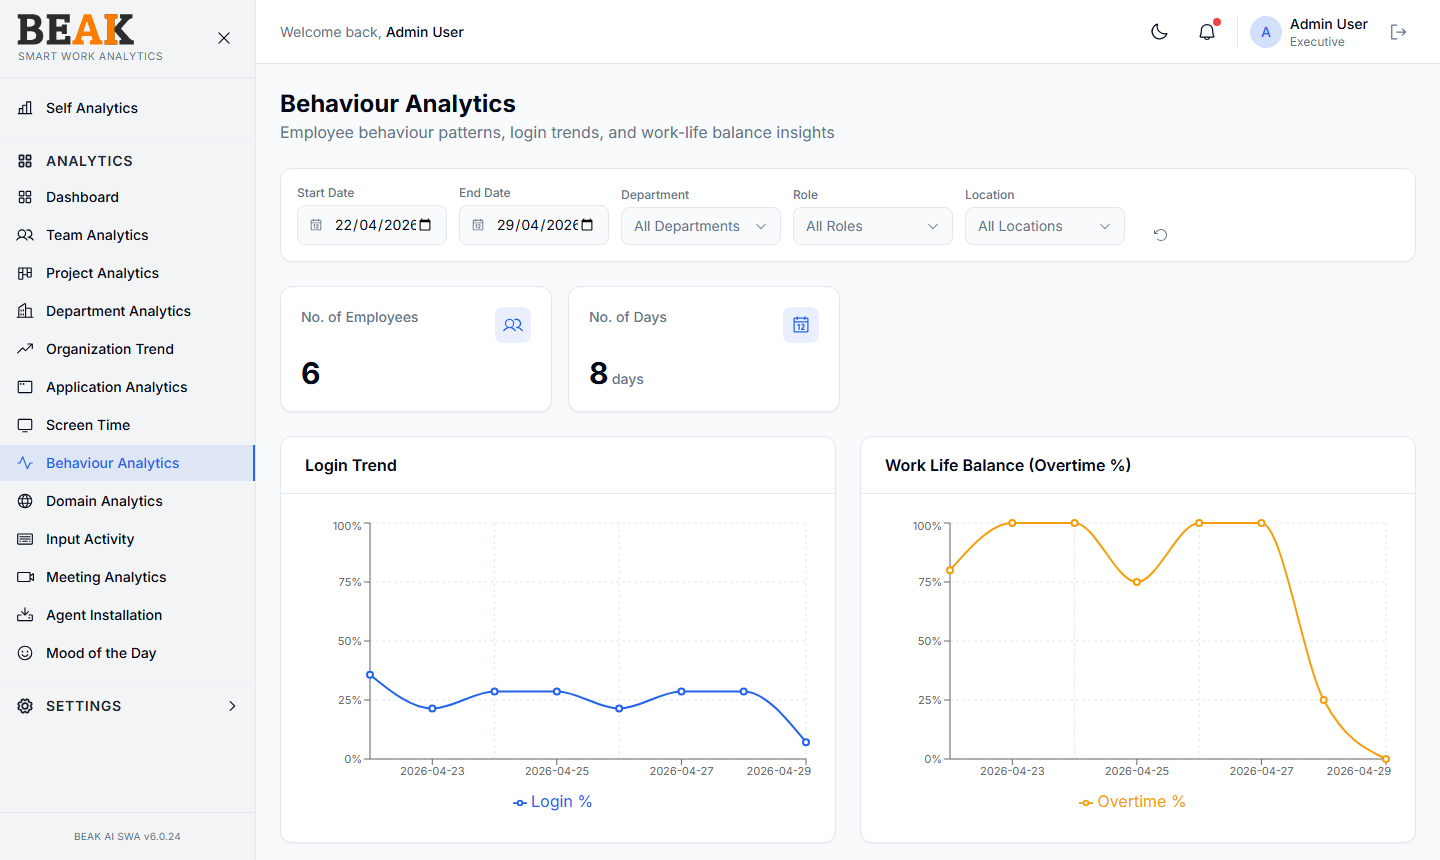
Filters
- Start Date / End Date — Period under analysis
- Department — Filter to a single department, or
All Departments - Role — Filter to a single role, or
All Roles - Location — Filter to a single location, or
All Locations - Reset — Circular arrow icon
Summary Tiles
- No. of Employees — Distinct employees in the filtered scope
- No. of Days — Calendar days covered by the selected window
Charts
Login Trend
A line chart showing the percentage of employees with at least one login per day across the period. Sustained low values indicate a fleet of devices that are either offline or unmapped — verify in Agent Installation.
Work Life Balance (Overtime %)
A line chart of the share of time spent outside the resolved shift (see Shifts). High overtime % over multiple weeks is a leading indicator of burnout. Compare against project deadlines to validate if the spike is project-driven or chronic.
Productive vs Non-Productive (Hrs)
A stacked or grouped bar chart contrasting productive vs non-productive hours per day. Together with Login Trend, this view tells a complete story — are people logged in, and is their time productive?
Best Practices
- Run a 4–8 week window for the cleanest behaviour signal — single-week windows are too noisy.
- A consistent
Overtime %above 20% for an individual department is grounds for a workload review — verify whether Shifts are correctly assigned before drawing conclusions. - Cross-check
Login Trendagainst Agent Installation — a falling login % may be a fleet of devices going dormant rather than a real behavioural shift. - For a single-employee deep dive, switch to Screen Time with the same filter set.
Related Pages
- Shifts — Shift definitions used to compute overtime
- Screen Time — Per-employee screen time
- Mood of the Day — Sentiment correlation
- Agent Installation — Verify device fleet health