Organization Trend
Organization Trend (page header reads Trend Analytics) is the long-window view of the organization's productivity — designed for executives who need to see how the whole company is moving over weeks or months rather than a single day.
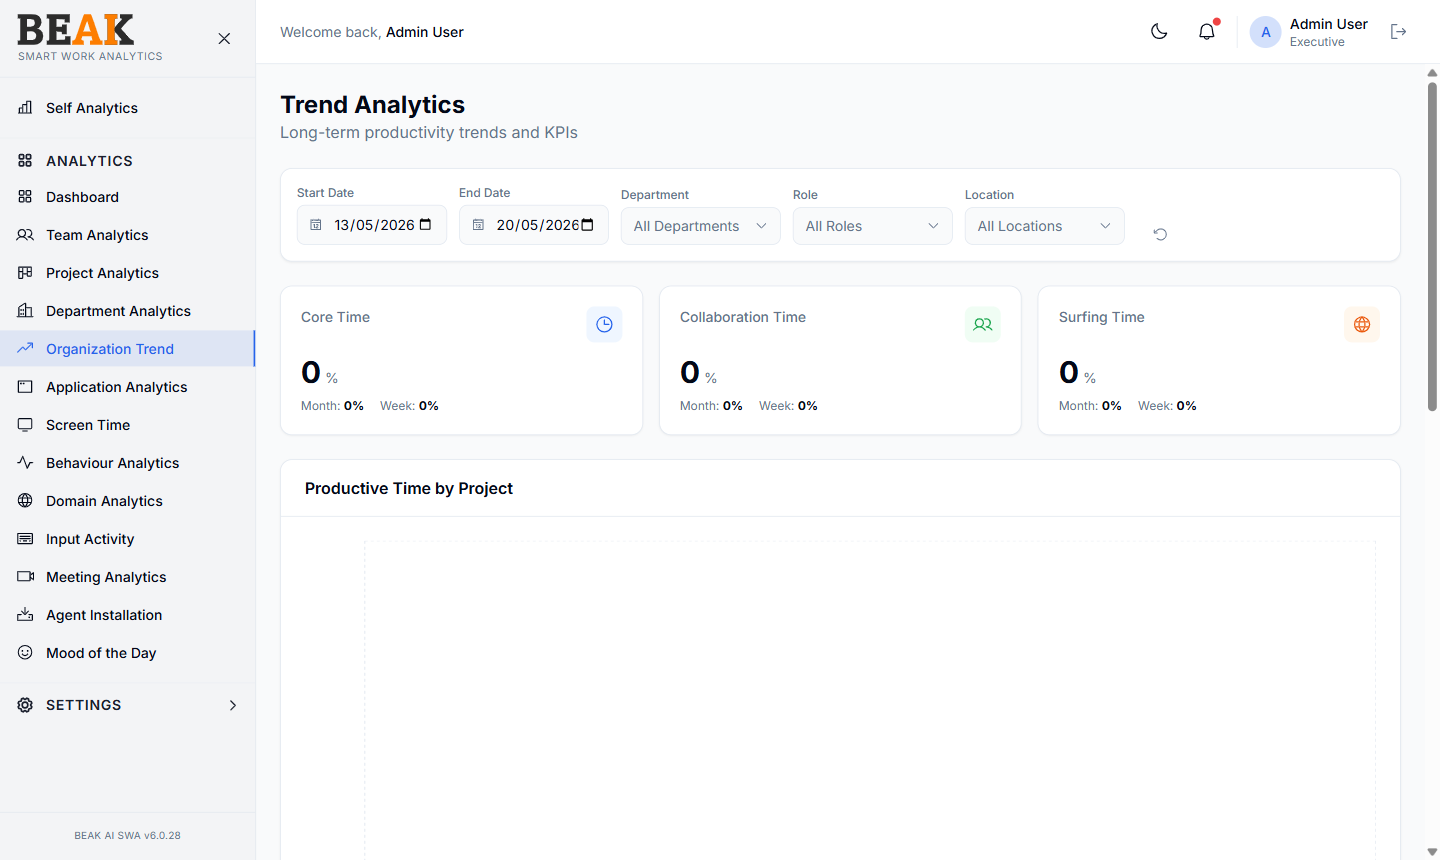
Filters
- Start Date / End Date — The trend window; pick a multi-week range for meaningful trend signal
- Department — Filter to a single department, or
All Departments - Role — Filter to a single role, or
All Roles - Location — Filter to a single location, or
All Locations
Summary Tiles
Three executive KPIs sit between the filter bar and the charts. Each tile shows the overall % for the selected window plus a Month: and Week: sub-stat for a quick-glance comparison.
- Core Time — % of total time spent in
Core Work,Development,Design, and other productive-creation categories - Collaboration Time — % of total time spent in
MeetingandCommunicationcategories - Surfing Time — % of total time spent on websites classified as
NeutralorUnproductiveunder Domain Categories
Note: The three tiles do not add to 100% — they are independent slices. Use them as health signals (e.g. surfing time creeping up week-on-week) rather than a strict accounting view.
Charts
Productive Time by Project
A line chart with one series per project, showing productive hours per day across the selected window. Use this to spot projects that are ramping up, ramping down, or stalling.
Productive Time by Department
A line chart with one series per department. Use this to compare the trend of each department over time — e.g. confirm that a hiring push in engineering is showing up as growing productive hours.
Activity Trend
A composite line chart with productive, idle, and unproductive series for the whole organization. The most useful single chart for "is the company getting better or worse over time."
Best Practices
- Use a 4–8 week window for the cleanest trend signal — shorter windows are noisy, longer windows blur structural changes.
- After a major change (reorg, new tooling, return-to-office) compare the four weeks before vs after by setting the date range and screenshotting; SWA does not yet offer a built-in baseline overlay.
- If a project's productive time falls suddenly, cross-check Project Analytics with the same window to see whether headcount or category mix changed.
- Filter by
Locationto validate WFH vs office productivity claims when running hybrid pilots.
Related Pages
- Dashboard — Single-period overview
- Department Analytics — Department comparison snapshot
- Project Analytics — Project-level drill-down
- Behaviour Analytics — Login and overtime patterns