Meeting Analytics
Meeting Analytics quantifies the cost of meetings — how much time the organization spends in Meeting category applications versus focused work. It pulls directly from the Categories configuration, so any application classified under Meeting (Microsoft Teams, Zoom, Google Meet, Webex, etc.) feeds this view.
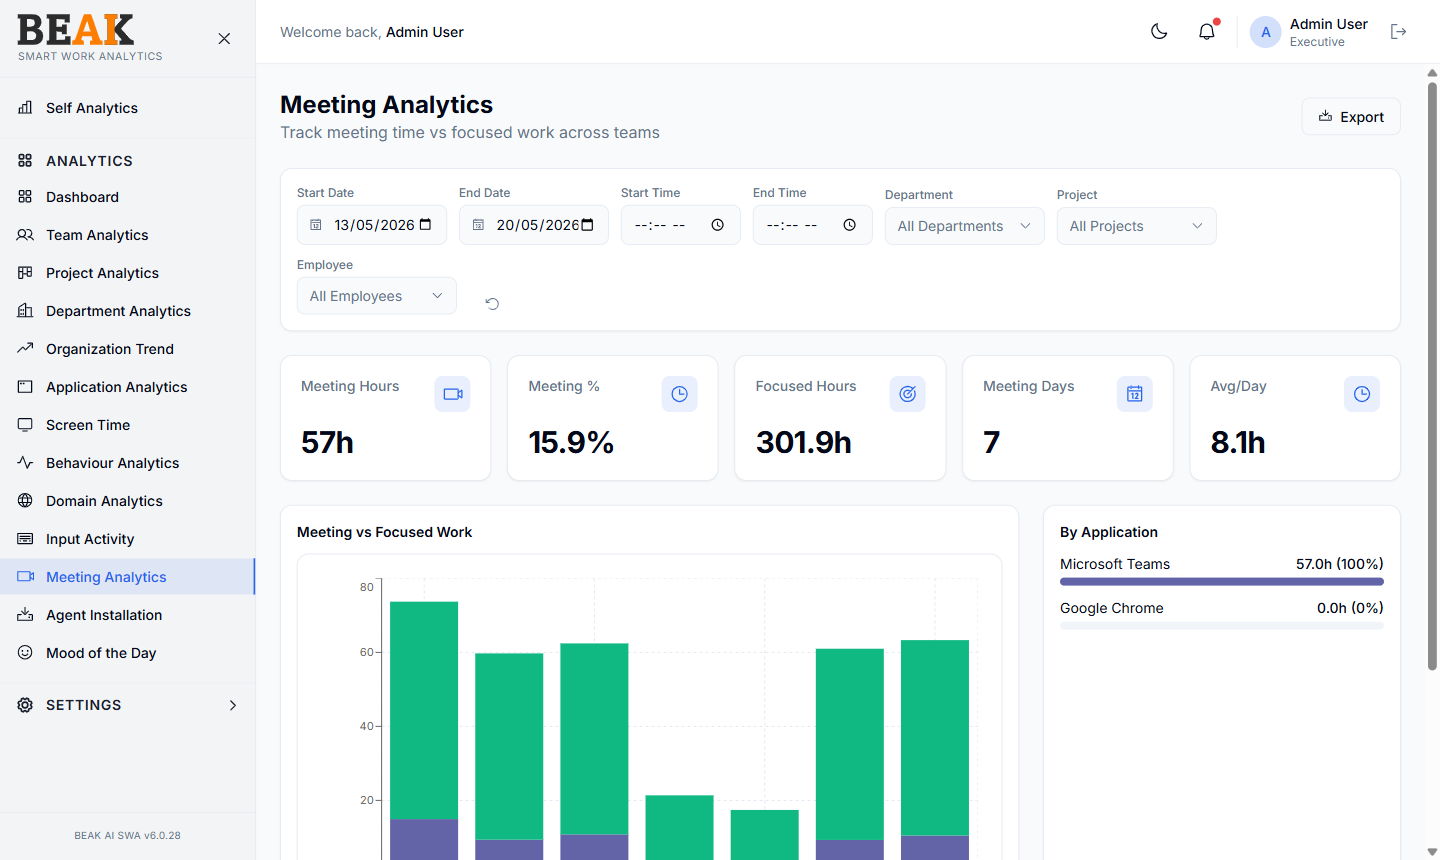
Filters
- Start Date / End Date / Start Time / End Time — Period under analysis
- Department — Filter to a single department, or
All Departments - Project — Filter to a single project, or
All Projects - Employee — Filter to a single employee, or
All Employees - Reset — Circular arrow icon
- Export — Download the breakdown as CSV
Summary Tiles
Five tiles sit at the top of the page and answer "how meeting-heavy was this period?" at a glance:
- Meeting Hours — Total hours spent in applications classified under the
Meetingcategory - Meeting % —
Meeting Hours / (Meeting + Focused Hours)— the share of working time that went to meetings - Focused Hours — Total hours spent in productive non-meeting categories (Core Work, Development, Design, Research)
- Meeting Days — Distinct calendar days that contained at least one meeting
- Avg/Day — Average meeting hours per
Meeting Days— useful for comparing meeting intensity across periods of different length
Charts
Meeting vs Focused Work
A stacked or grouped bar chart per day showing two series:
- Meeting — Hours spent in applications classified under the
Meetingcategory - Focused Work — Hours spent in productive non-meeting categories (Core Work, Development, Design, Research)
The most common use of this view is to spot whether a particular team is meeting-heavy on certain days of the week — a Wednesday spike is a classic standup-overload signal.
By Application
A horizontal bar chart of meeting hours per application. If your organization standardizes on one meeting platform, this chart should be dominated by it; multiple bars may indicate rogue meeting tools.
Best Practices
- Set a target ratio of meeting time to focused work for each department (e.g. ≤ 25% for engineering) and check this view weekly.
- Combine
DepartmentandProjectfilters to investigate whether a specific project is meeting-bound — this often surfaces missing async-communication norms. - Check the
By Applicationchart to detect when teams are using non-standard meeting tools — useful for IT consolidation efforts.
Related Pages
- Application Analytics — Application detail
- Categories — Configure which apps count as
Meeting - Screen Time — Total screen time
- Behaviour Analytics — Overtime patterns