Team Analytics
Team Analytics is the manager-level view that shows productivity for a slice of the organization filtered by project, employee, or role. It surfaces team-size headcount, total hours, and team productivity %, alongside a daily screen-time breakdown, top applications, and a sortable team-members table.
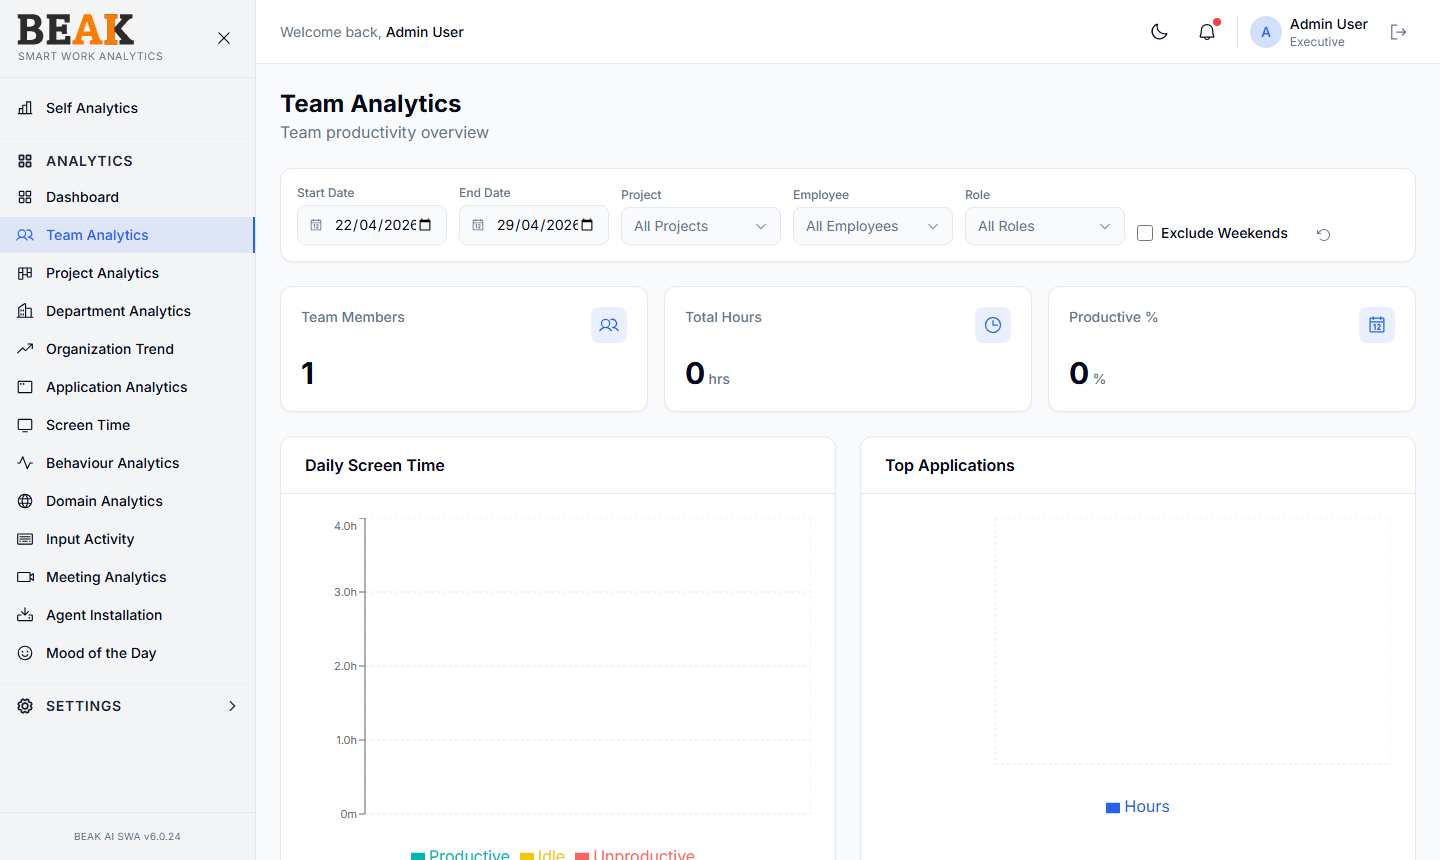
Filters
The filter bar at the top of the page lets a manager scope the view:
- Start Date / End Date — Defaults to the last 7 days
- Project — Filter to a single project, or
All Projects - Employee — Filter to a single employee, or
All Employees - Role — Filter by job role, or
All Roles - Exclude Weekends — Toggle to omit Saturday and Sunday from calculations
- Reset — The circular arrow icon resets all filters
- Export — Download the filtered view as CSV
Summary Tiles
Three header tiles show the team's high-level state:
- Team Members — Count of distinct users in the filtered scope
- Total Hours — Total productive + unproductive hours for the team in the period
- Productive % — Share of productive hours over (productive + unproductive) hours
Daily Screen Time
A stacked bar chart that breaks each day into productive, idle, and unproductive hours for the team aggregate. Use this to spot daily patterns — e.g. unusually high idle on a release day, or a pattern of late-day unproductive spikes.
Top Applications
A bar chart ranking the team's most-used applications by total hours. This helps a team lead validate whether the team is spending time on the right tools — e.g. a development team should see their IDEs, source-control, and ticketing tools at the top.
Team Members
A sortable table listing each member of the filtered team:
| Column | Description |
|---|---|
| Name | Member full name and avatar |
| Work email address | |
| Productivity | Productive % with a gauge bar |
| Hours | Productive hours in the period |
| Active Days | Distinct days with reported activity |
Click any column header to sort. Use the Employee filter to drill into a specific member.
Best Practices
- Apply a
Projectfilter at the start of every sprint review to scope the view to the active project. - Watch for low
Active Days— a member with a high productive % but few active days may be on PTO or have a device issue (verify in Agent Installation). - Use
Exclude Weekendsfor project teams that are not on a 7-day rotation to avoid skewing averages. - For deeper trend analysis across the team, switch to Organization Trend with the same project filter.
Related Pages
- Project Analytics — Project-level time allocation
- Department Analytics — Department comparison
- Screen Time — Per-employee screen time detail
- Organization Trend — Multi-period trends