Project Analytics
Project Analytics answers "where is my project's time going" — both in absolute hours and across roles. It breaks down screen time, productive time, activity time, and per-role time for any project, and ranks the top applications used inside that project.
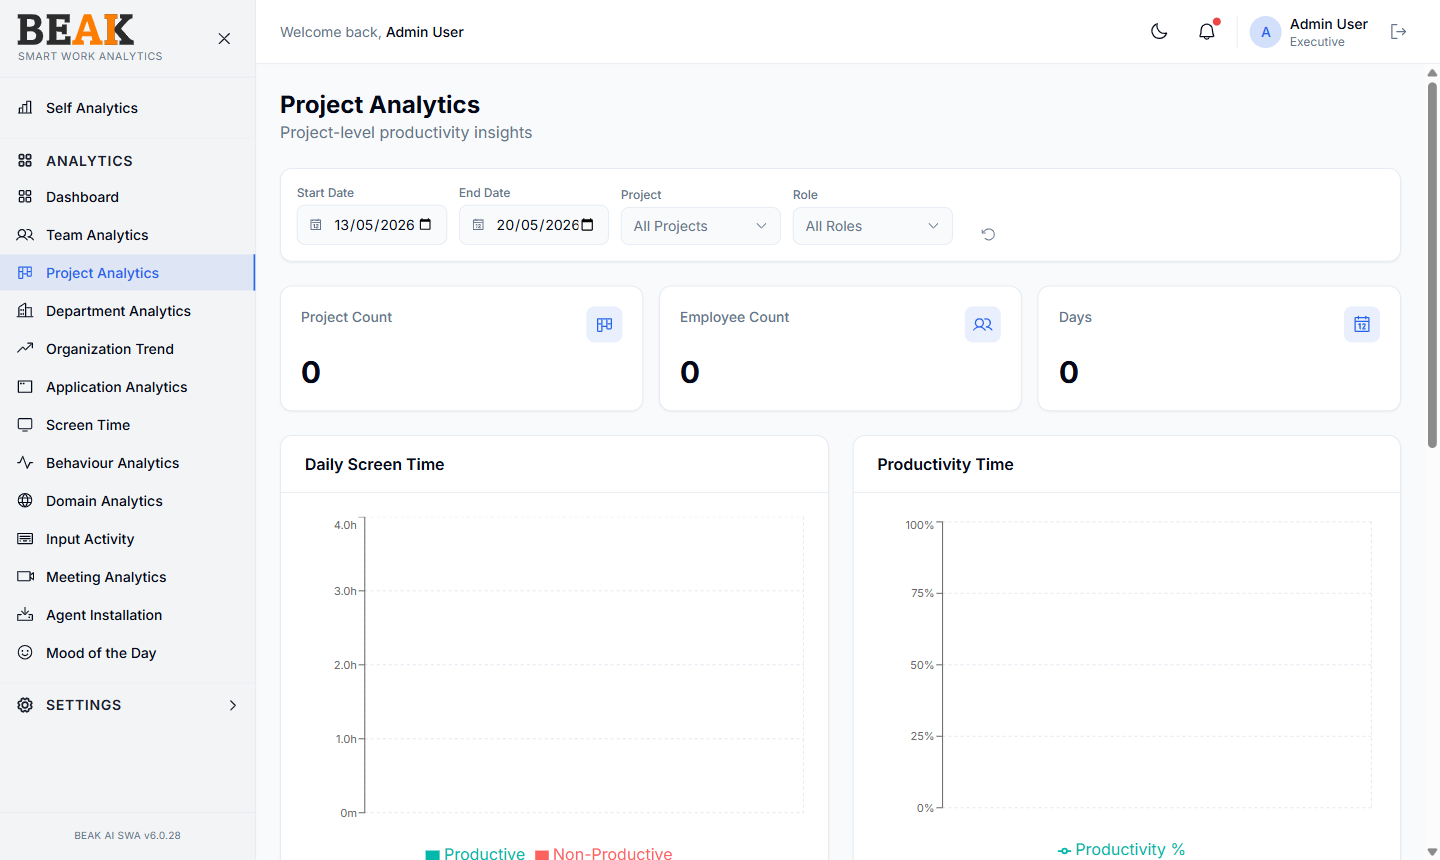
Filters
- Start Date / End Date — Period under analysis
- Project — Required scope; defaults to
All Projects - Role — Filter to a single role within the project (e.g.
Developer,QA), orAll Roles
Summary Tiles
Three tiles sit between the filter bar and the charts and roll up the selected scope:
- Project Count — Distinct projects in the filtered scope
- Employee Count — Distinct employees with activity on those projects
- Days — Calendar days in the selected window that have at least one recorded minute
Charts
The page surfaces five analytical views, each backed by the same date and project filters.
Daily Screen Time
A stacked bar chart of productive and non-productive hours per day for the selected project. Use this to spot the day-to-day rhythm of the project — consistent non-productive spikes can hint at scope or motivation issues, while empty days flag stalled work.
Productivity Time
Total productive hours per day, isolated from idle and unproductive contributions. The chart trend line makes it easy to see whether productive output is climbing or falling over the period.
Activity Time
A stacked bar chart of activity hours per day, split by application category — typically Development, Communication, Browsing, and Idle. Useful for verifying that team members are logged in and present, and for confirming the category mix is what you expect for the project.
Role Time
Hours grouped by role within the project. A balanced bar means the project is staffed roughly as expected; a skewed bar signals over- or under-investment in a particular role.
Top Applications by Project
A horizontal bar chart of the most-used applications inside the project. Combined with the Categories configuration, this confirms whether the project is using the expected toolchain.
Best Practices
- Set the
Projectfilter to a specific project at the start of every sprint review — leaving it onAll Projectsaggregates company-wide noise. - Use the
Rolefilter to compare time spent across roles when investigating why a project is over budget — over-engineering often shows as outsized developer hours vs design/QA. - Cross-reference the
Top Applicationschart against Categories to make sure the project's primary tools are classified correctly. - For employee-level detail inside a project, switch to Team Analytics with the same project filter.
Related Pages
- Projects — Manage the project catalog
- Team Analytics — Member-level breakdown
- Application Analytics — Application usage detail
- Shifts — Project-level shift overrides