Application Analytics
Application Analytics is the most-used analytics view for IT and procurement teams — it answers "what tools are people actually using, and how productively." Every captured application is rolled up across the organization (or filtered scope) and ranked by hours, productivity, devices, and category.
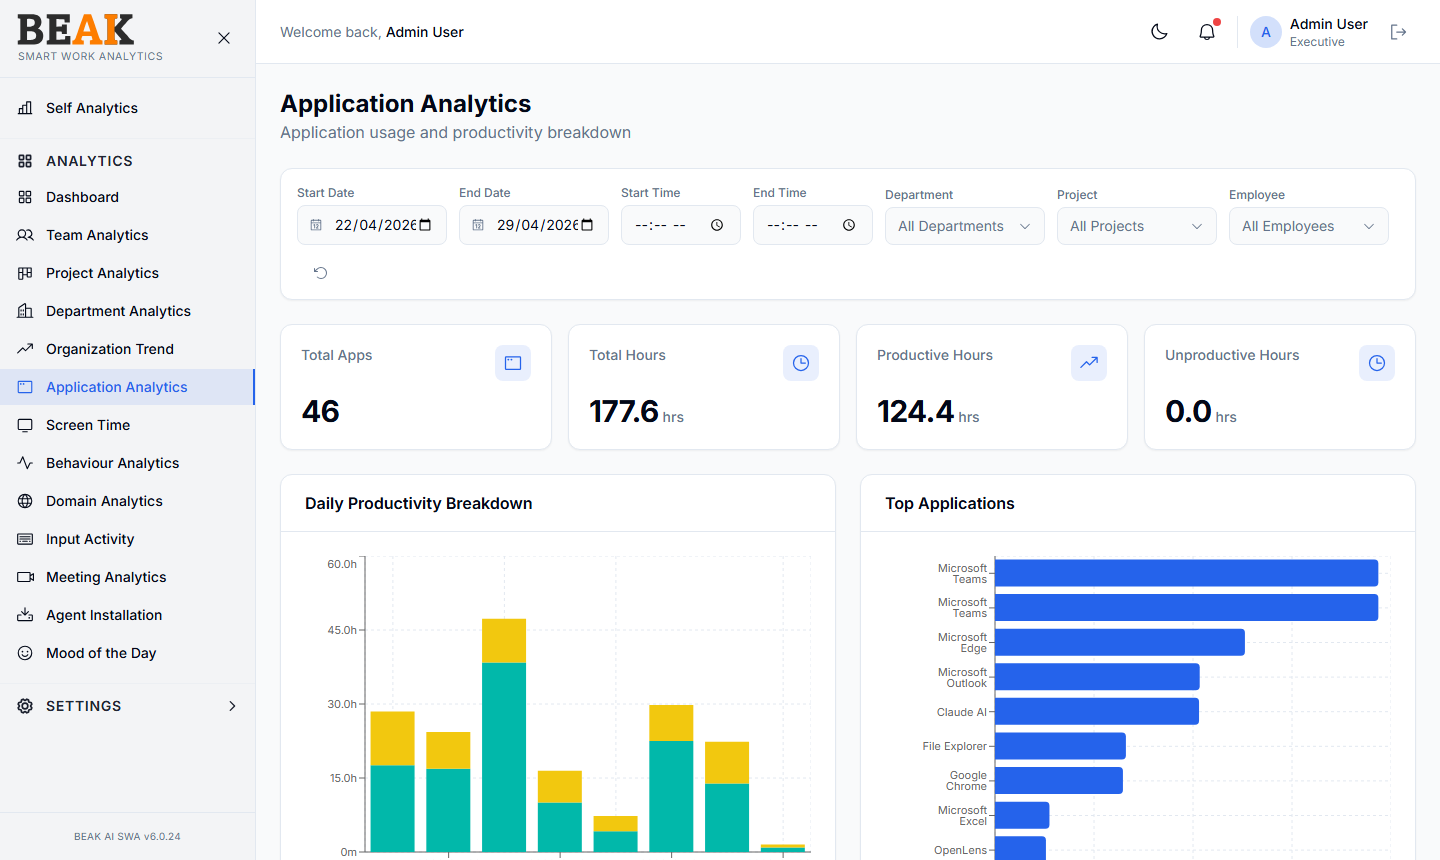
Filters
- Start Date / End Date / Start Time / End Time — Period under analysis
- Department — Filter to a single department, or
All Departments - Project — Filter to a single project, or
All Projects - Employee — Filter to a single employee, or
All Employees - Reset — Circular arrow icon
- Export — Download the application grid as CSV
Summary Tiles
- Total Apps — Distinct applications captured in the period
- Total Hours — Sum of usage hours across all applications
- Productive Hours — Hours from applications classified as productive
- Unproductive Hours — Hours from applications classified as unproductive
Daily Productivity Breakdown
A stacked bar chart showing productive (green) and idle (yellow) application hours per day. Use this to find structural patterns — e.g. high productive hours on Tuesday-Thursday and low productive hours on Friday is a common signal of meeting overload or team rituals.
Top Applications
A horizontal bar chart of the top applications by total hours for the filtered scope. The bars are color-coded by category so productive apps (Microsoft Teams, Outlook, Edge, Excel) are visually separated from non-productive apps.
Application Grid
A sortable, paginated table with one row per application:
| Column | Description |
|---|---|
| Application | App display name |
| Category | Productivity category (e.g. Communication, Core Work) |
| Productivity | Productive / Neutral / Unproductive flag |
| Hours | Total usage hours in the period |
| % of Total | Share of total app time |
| Devices | Distinct devices that ran the app |
Pagination controls (First, Prev, Next, Last) navigate large fleets. Click any column header to sort.
Best Practices
- Run with
All DepartmentsandAll Projectsto surface the global top apps — a useful input to license-rationalization conversations. - Run with a
Departmentfilter to validate that each department is using the expected applications. - High
Hoursand lowDevicesmeans a small group is using something heavily — a signal to check whether it's a power-user workflow worth scaling, or a niche tool worth retiring. - Cross-reference the grid with Applications to recategorize apps that are misclassified or
Uncategorized. - Use the
Exportbutton to send the grid to procurement for license consolidation.
Related Pages
- Applications — Manage application catalog and categories
- Categories — Configure productivity categories
- Domain Analytics — Website usage breakdown
- Screen Time — Per-employee screen time