SD-WAN Management
Beak NOC's SD-WAN Management page gives you a unified view of all your Software-Defined WAN tunnels — including real-time health scoring, per-tunnel latency and packet loss, and jitter measurements.
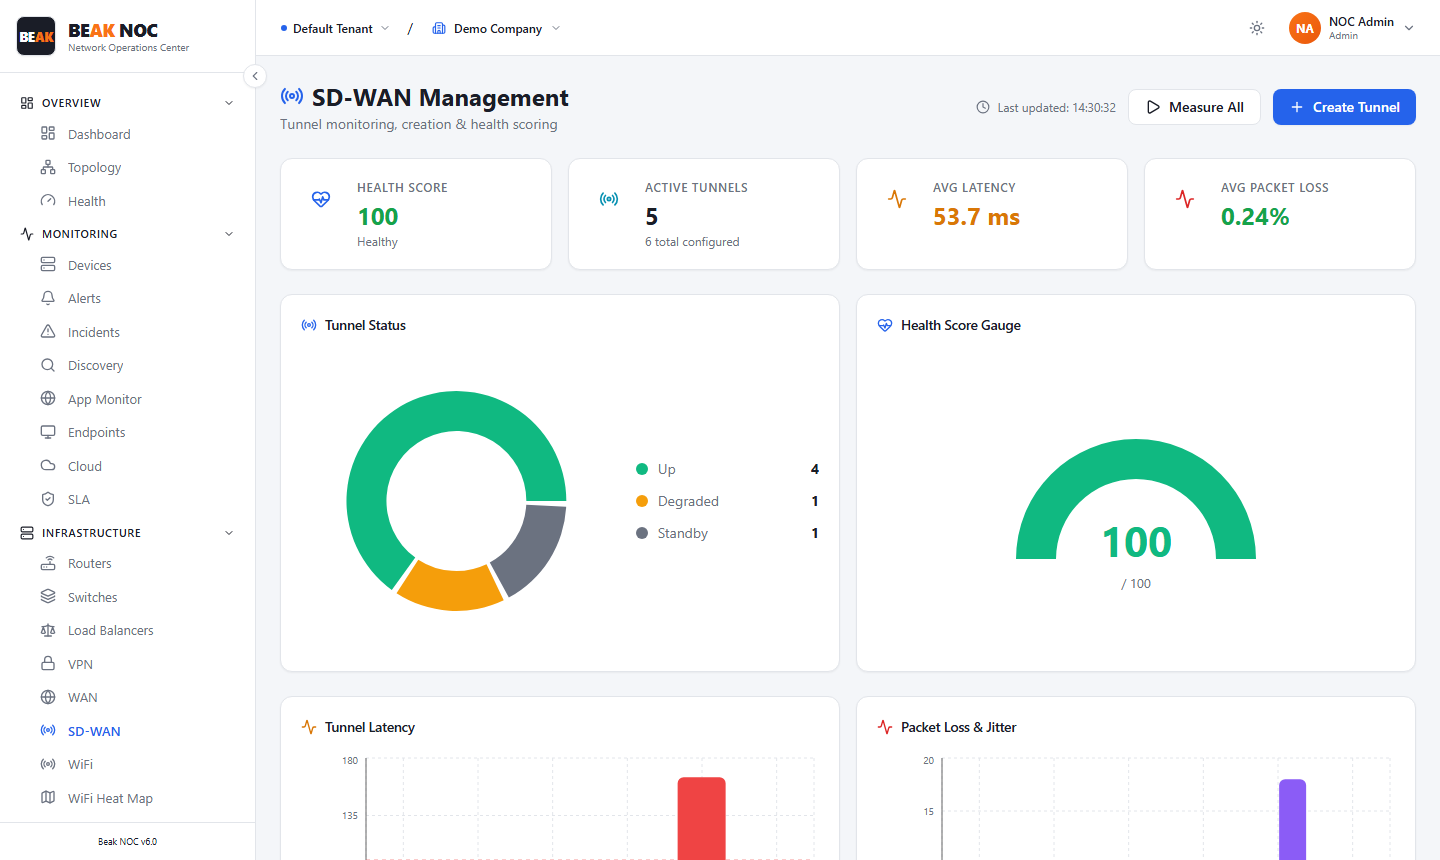
Summary Cards
| Card | Description |
|---|---|
| Health Score | Composite health status of the SD-WAN estate |
| Active Tunnels | Number of tunnels currently in an Up state out of the total configured |
| Avg Latency | Average round-trip latency across all measured tunnels in milliseconds |
| Avg Packet Loss | Average packet loss percentage across all measured tunnels |
Tunnel Status
A donut chart showing the distribution of tunnels across three states:
- Up — Tunnel is active
- Degraded — Tunnel is up but performance metrics exceed warning thresholds
- Standby — Tunnel is in standby mode
Health Score Gauge
A circular gauge displays the composite SD-WAN health score (0–100).
Tunnel Latency Chart
A bar chart comparing round-trip latency for each configured tunnel side by side.
Packet Loss & Jitter Chart
A grouped bar chart showing packet loss (%) and jitter (ms) per tunnel.
Tunnel Management
Measure All
Click Measure All to trigger an on-demand measurement of all tunnel metrics (latency, packet loss, jitter).
Create Tunnel
Click Create Tunnel to define a new SD-WAN tunnel.
Related Pages
- Network Flows — Flow analysis showing which applications use each tunnel
- Alerts — Alerts triggered when tunnel health degrades