WAN Monitoring
WAN Monitoring gives your NOC team a centralised view of all Wide Area Network links, measuring real-time latency, jitter, packet loss, and SLA compliance for every site-to-site connection. Rather than relying on per-device checks, this page aggregates link-level performance data so your team can immediately see which WAN paths are degrading and act before users are impacted.
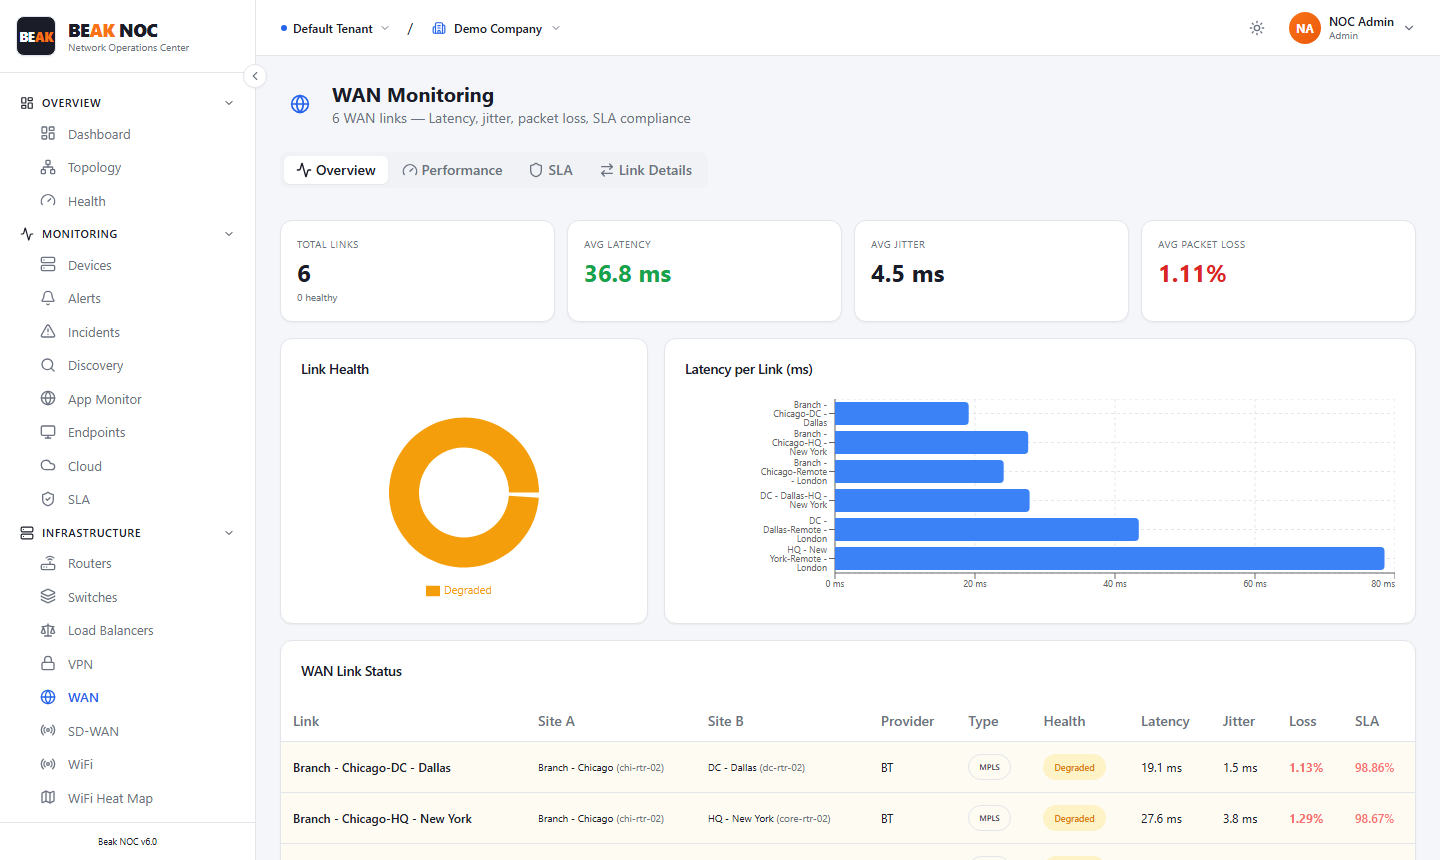
Summary Cards
| Card | Description |
|---|---|
| Total Links | Count of WAN links being monitored |
| Avg Latency | Average round-trip latency across all active WAN links in milliseconds |
| Avg Jitter | Average jitter across all active WAN links in milliseconds |
| Avg Packet Loss | Average packet loss percentage across all monitored WAN links |
Tabs
| Tab | Description |
|---|---|
| Overview | Link health donut chart, latency bar chart, and full WAN link status table |
| Performance | Time-series performance trends per link |
| SLA | SLA compliance tracking per link against defined targets |
| Live Data | Real-time packet-level measurements across all links |
Link Health
A donut chart showing the distribution of WAN links by health state:
- Healthy — Link is performing within acceptable thresholds
- Inactive — Link is not currently passing traffic or is unreachable
Latency per Link
A bar chart comparing the round-trip latency for each WAN link side by side. Use this to quickly identify which links have the highest latency contribution.
WAN Link Status Table
The main table lists every monitored WAN link with:
| Column | Description |
|---|---|
| Site A | Source site of the WAN link |
| Site B | Destination site of the WAN link |
| Provider | WAN service provider for this link |
| Type | Link technology (e.g., MPLS, Broadband, LTE) |
| Quality | Composite quality indicator for this link |
| Latency | Current round-trip latency in milliseconds |
| Jitter | Current jitter in milliseconds |
| Loss | Current packet loss percentage |
| Status | Link health state |
Related Pages
- SD-WAN Management — Software-defined overlay tunnels built on WAN links
- VPN Monitoring — VPN tunnels traversing WAN paths
- Alerts — WAN link degradation and failure alerts