Traffic Analysis & Bandwidth Utilization
Beak NOC provides two complementary views for understanding how bandwidth is being consumed across your network: Traffic Analysis for per-device traffic volume trends, and Bandwidth Utilization for interface-level utilization percentages.
Traffic Analysis
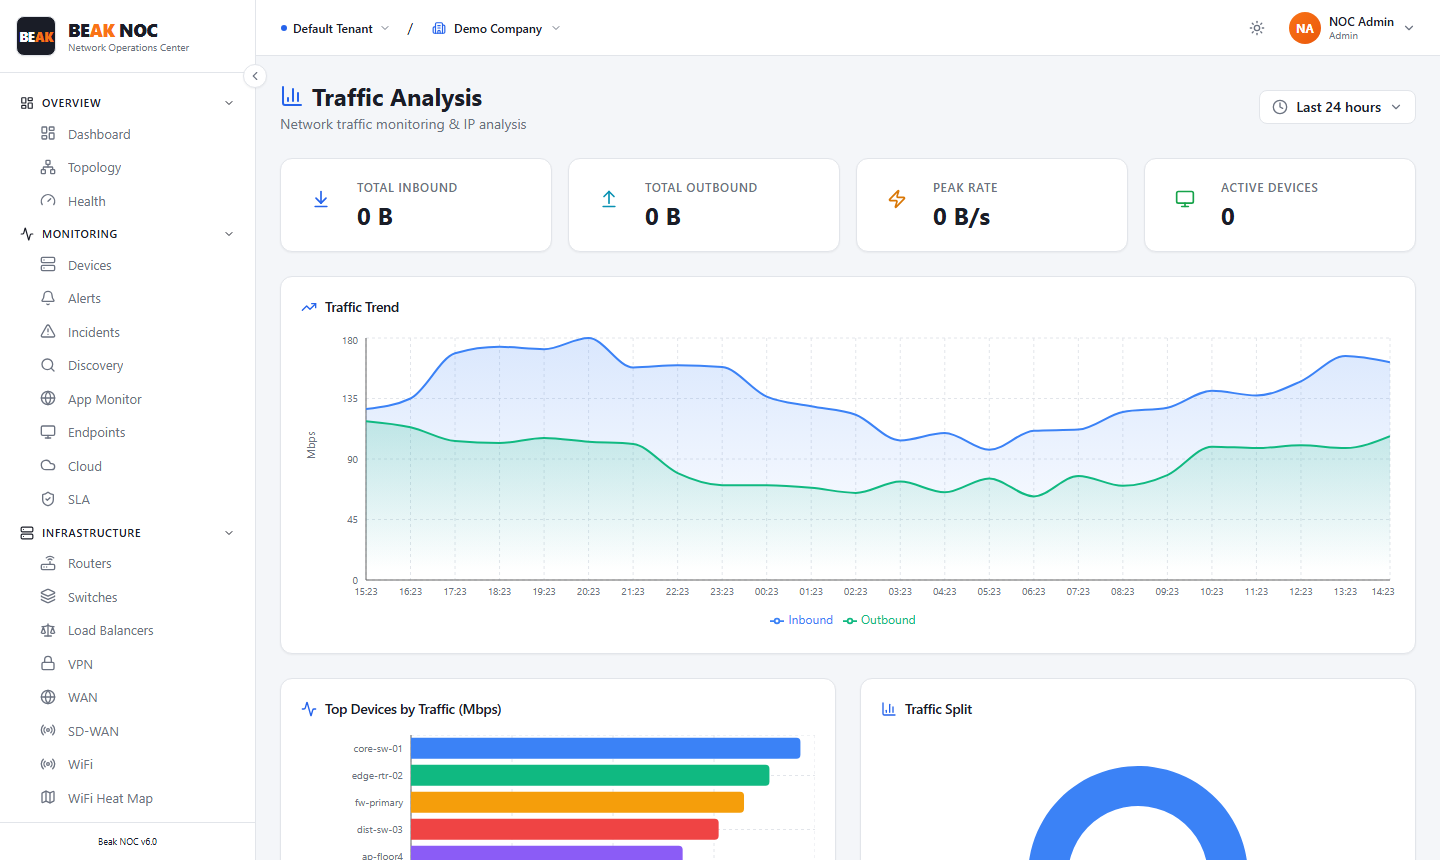
Traffic Analysis monitors network-wide inbound and outbound traffic in real time, ranked by device, with time-range filtering for trend analysis.
Summary Cards
| Card | Description |
|---|---|
| Total Inbound | Aggregate inbound traffic volume across all monitored interfaces |
| Total Outbound | Aggregate outbound traffic volume |
| Peak Rate | Highest instantaneous traffic rate observed |
| Active Devices | Count of devices actively generating or receiving traffic |
Traffic Trend
A dual-line area chart showing inbound and outbound traffic over the selected time range.
Top Devices by Traffic (Mbps)
A bar chart ranking devices by their total traffic contribution.
Traffic Split
A chart showing the breakdown of traffic by protocol or direction.
Bandwidth Utilization
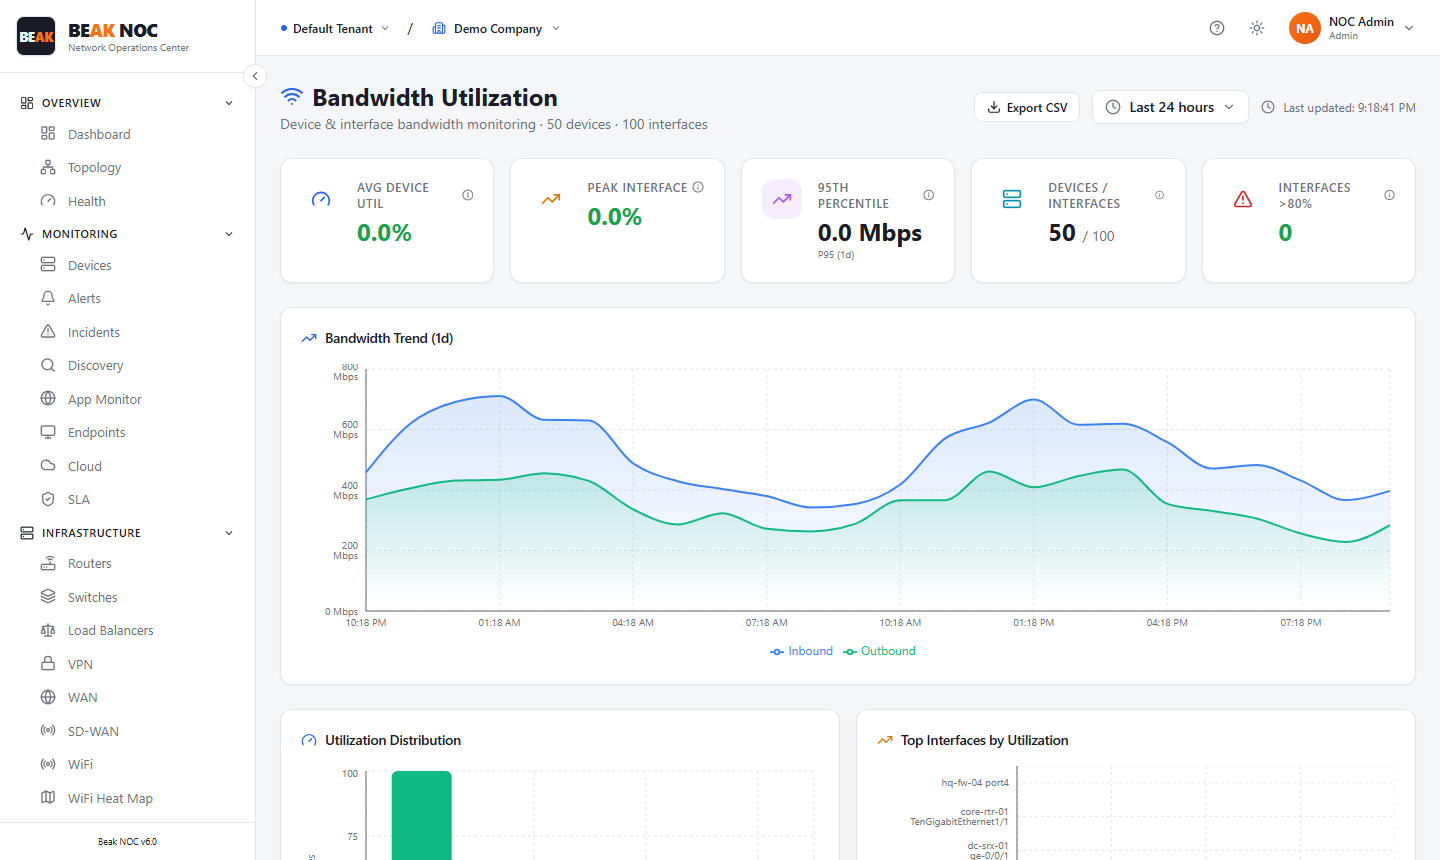
Bandwidth Utilization monitors individual network interfaces to track how close each link is to its capacity.
Summary Cards
| Card | Description |
|---|---|
| Avg Utilization | Average utilization percentage across all monitored interfaces |
| Peak Utilization | Highest single-interface utilization recorded |
| Total Interfaces | Count of interfaces being monitored |
| Over 80% | Count of interfaces currently above 80% utilization |
Bandwidth Trend (24 Hours)
A dual-line area chart showing aggregate inbound and outbound bandwidth utilization over the last 24 hours.
Utilization Distribution
A histogram showing the distribution of interfaces by utilization bucket.
Top Interface by Utilization
A ranked list of the interfaces with the highest current utilization.
Related Pages
- Network Flows — What applications and protocols are consuming bandwidth
- Reports — Export bandwidth usage reports
- Dashboard — Top bandwidth consumers visible on the NOC Dashboard