Network Topology
The Topology page renders a live, interactive map of your network. Every discovered device appears as a node; links between devices represent detected connections. Use this view to understand your network's physical and logical layout, spot unreachable devices instantly, and export the map for documentation or change-management purposes.
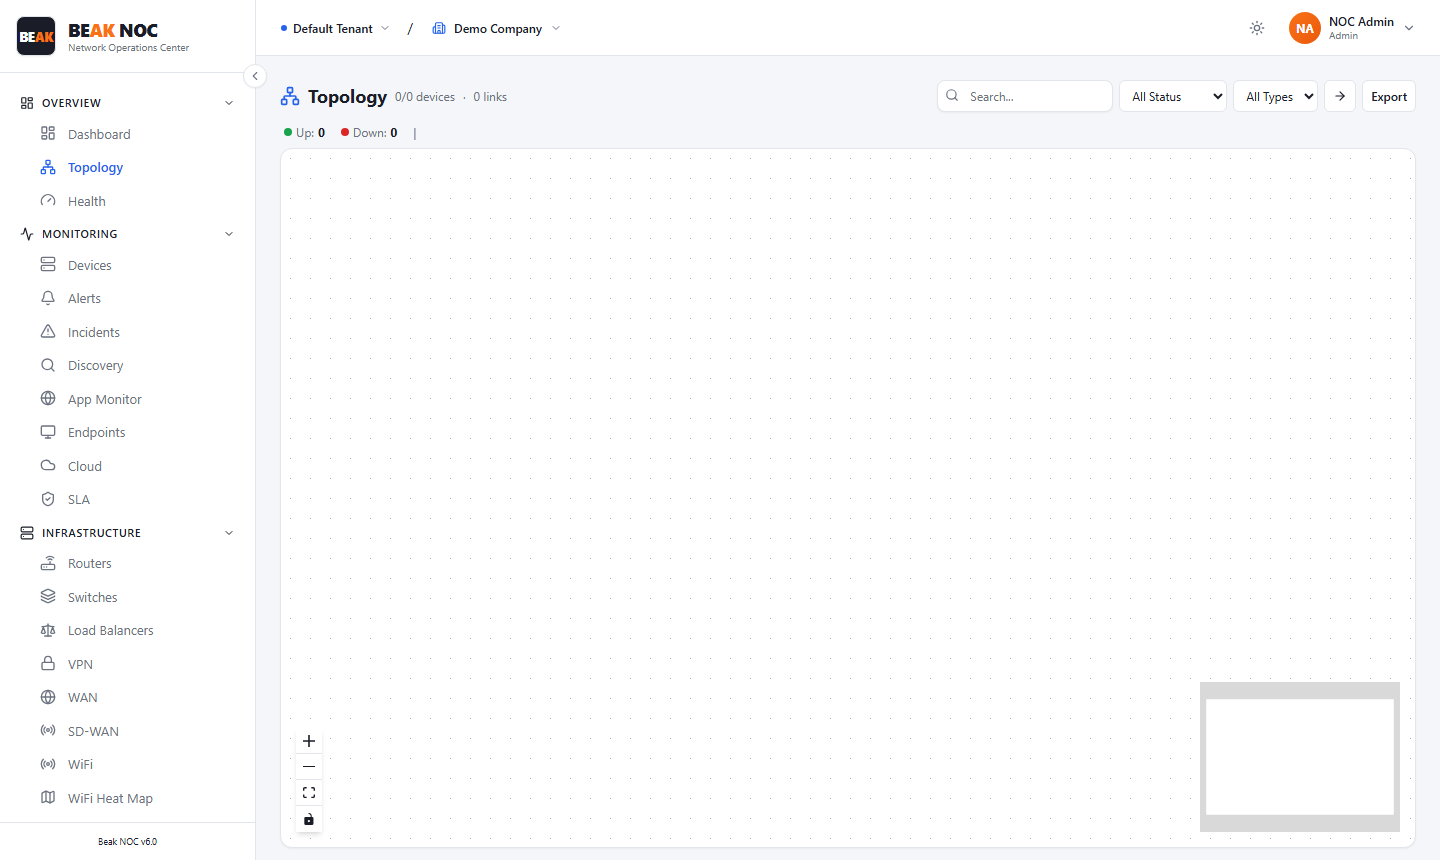
Map Canvas
The topology renders on an infinite canvas. Use the mouse or trackpad to pan and zoom. Nodes are color-coded by status:
- Green — Device is Up and reachable
- Red — Device is Down or unreachable
- Gray — Device status unknown (not yet polled)
Links between nodes reflect discovered connectivity. Hovering over a node reveals device details; clicking a node opens its full device profile.
Status Summary Bar
Directly above the canvas, a summary bar shows the current Up and Down device counts in real time:
Up: N— Number of devices currently reachableDown: N— Number of devices currently unreachable
Controls
| Control | Description |
|---|---|
| Search | Search for a device by hostname or IP address to locate and highlight it on the map |
| All Status | Filter nodes by status — show All, Up only, or Down only |
| All Types | Filter nodes by device type — Router, Switch, Firewall, Server, Access Point, etc. |
| Export | Download the current topology view as an image for documentation |
| +/− | Zoom in and out on the canvas |
| Fit to screen | Auto-fit all nodes within the visible viewport |
Populating the Topology
The topology map is populated automatically after running a Network Discovery scan.
Related Pages
- Discovery — Run a scan to populate the topology
- Devices — Full device inventory list view
- Network Health — Health scoring across all devices