NOC Dashboard
The NOC Dashboard is the central command view for your Network Operations Center. It surfaces the most critical network signals in real time so operators can assess overall network health at a glance and navigate directly to any area that needs attention.
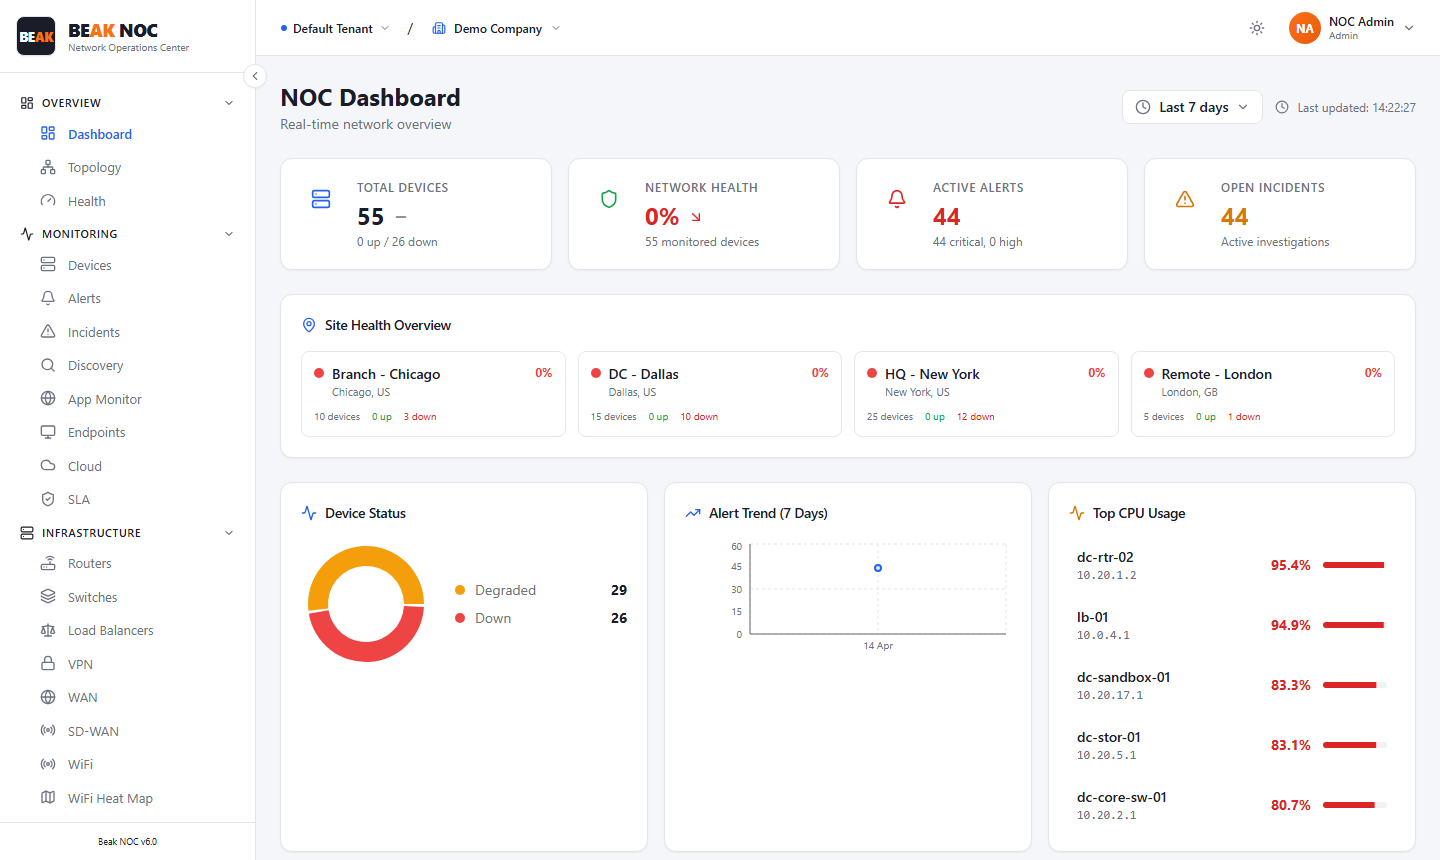
KPI Summary Cards
Four summary cards run across the top of the dashboard, each showing the current state of a key metric.
- Total Devices — Count of all devices under monitoring, with an Online / Down breakdown showing how many are currently reachable versus unreachable.
- Network Health — A percentage score representing the overall health of your monitored network.
- Active Alerts — Count of alerts currently firing, with a breakdown of Critical and High severity alerts highlighted separately.
- Open Incidents — Number of incidents currently open.
Dashboard Widgets
Device Status
A donut chart showing the current distribution of device states — Online, Degraded, or Down — across all monitored devices.
Alert Trend (7 Days)
A line chart showing the volume of alerts generated over the last seven days. Use this to identify recurring patterns, peak alert periods, or improvements following remediation work.
Top CPU Usage
Displays the devices with the highest current CPU utilization.
Top Bandwidth In (Download)
Ranks devices by inbound bandwidth consumption.
Top Bandwidth Out (Upload)
Ranks devices by outbound bandwidth consumption.
Header Controls
- Tenant selector — Switch between tenants (top-left breadcrumb) if your account manages multiple organizations.
- Company filter — Filter all dashboard data to a specific company within the selected tenant. Default shows All Companies.
Related Pages
- Alerts — Full alert list with severity filtering
- Incidents — Incident lifecycle management
- Network Health — Detailed health score breakdown
- Traffic — Per-device traffic trends
- Bandwidth — Interface bandwidth utilization