Application Monitor
Beak NOC's Application Monitor extends network observability to the application layer. Rather than only monitoring devices and links, Application Monitor tracks HTTP endpoints, REST APIs, and web applications from the outside in — measuring availability, response time, SSL certificate health, and the success of synthetic transactions.
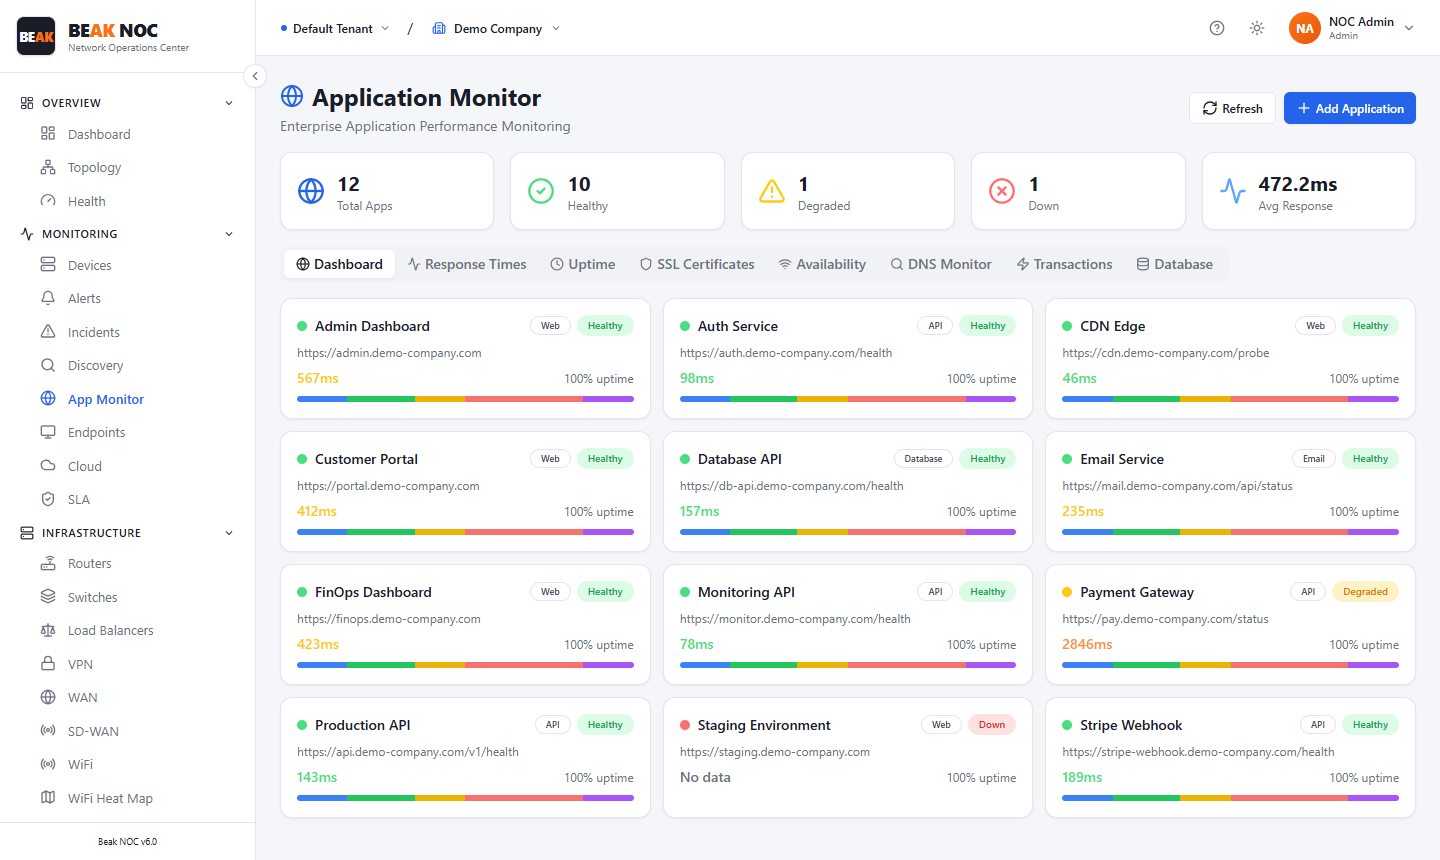
Overview
Application Monitor works by sending synthetic HTTP/HTTPS probes to registered application endpoints at configurable intervals. These probes measure:
- Availability — Is the application returning a successful HTTP response (2xx)?
- Response Time — How long does the application take to respond (in milliseconds)?
- SSL Certificate Health — Is the certificate valid and not approaching expiry?
- Transaction Success — Do multi-step synthetic transactions complete end-to-end?
This gives you application-level SLA visibility that pure network monitoring cannot provide — a network may be fully healthy while an application is returning 500 errors.
Summary Cards
| Card | Description |
|---|---|
| Total Apps | Count of applications registered for monitoring |
| Healthy | Applications returning successful responses within response time thresholds |
| Degraded | Applications responding but exceeding response time thresholds |
| Down | Applications not responding or returning error status codes |
| Avg Response | Average response time across all healthy applications (in ms) |
Dashboard Tabs
Dashboard Tab
The default view shows a health summary card for every monitored application — colour-coded by status (green/amber/red) with current response time and uptime percentage.
Response Times Tab
A time-series chart showing response time trends for all monitored applications over the selected time range. Use this to identify:
- Performance degradation — An application that was fast yesterday but is slow today
- Time-of-day patterns — Peak load during business hours causing response time spikes
- Correlated slowdowns — Multiple applications slowing simultaneously (may indicate a shared infrastructure issue)
Uptime Tab
Uptime tracking shows the availability percentage for each application over the selected period (daily, weekly, monthly). Compare uptime against contractual SLAs or internal targets.
SSL Certificates Tab
Lists the SSL/TLS certificates for all monitored application endpoints with:
| Column | Description |
|---|---|
| Host | Application hostname |
| Expires | Certificate expiry date |
| Days Left | Days until expiry — colour-coded (red = expired/imminent, amber = <30 days, green = valid) |
| Protocol | TLS version in use |
Transactions Tab
Multi-step synthetic transactions simulate a real user interaction with an application — for example, logging in, submitting a form, or completing a checkout flow. Each step is monitored individually so failures can be pinpointed to the exact step that broke.
Adding an Application
Click Add Application to register a new application for monitoring. Configure:
- Name — Descriptive label (e.g.,
Beak Portal - Login) - URL — The endpoint URL to probe (e.g.,
https://portal.beakops.com/login) - Method — HTTP method (
GET,POST, etc.) - Interval — How frequently to probe (e.g., every 60 seconds)
- Timeout — Maximum acceptable response time before marking as degraded
- Expected Status Code — The HTTP status code considered successful (default: 200)
- Alert Thresholds — Response time and consecutive failure counts that trigger alerts
Best Practices
- Monitor both the frontend and backend — Add both the user-facing URL and any critical API endpoints separately to pinpoint whether failures are UI-layer or API-layer.
- Set realistic timeout thresholds — A 5-second timeout is reasonable for a web page; a 500 ms timeout is appropriate for an API endpoint.
- Use synthetic transactions for critical paths — Monitor the login flow, not just the homepage — a broken authentication page is more impactful than a slow static page.
- Correlate with network alerts — When an application goes down, check Alerts to determine whether the cause is the application itself or a broader network issue.