Flow Analytics & Path Flows
Flow Analytics
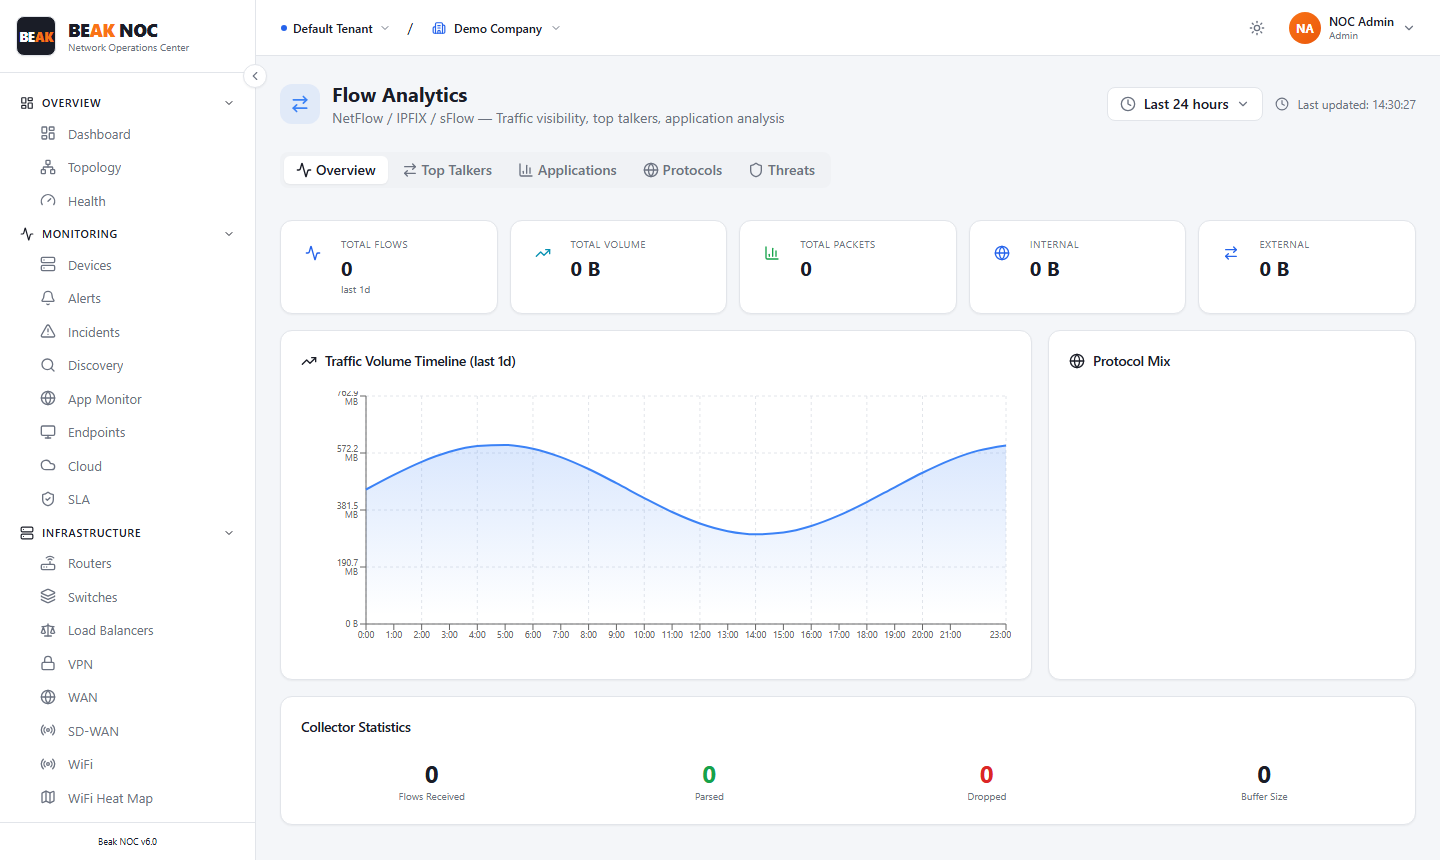
Flow Analytics collects and analyzes flow data from your network devices to give you full visibility into what traffic is traversing your network.
Summary Cards
| Card | Description |
|---|---|
| Total Flows | Count of flow records collected in the current monitoring period |
| Total Bytes | Aggregate data volume represented by collected flows |
| Total Packets | Total packet count across all flows |
Tabs
| Tab | Description |
|---|---|
| Overview | Summary charts and collector statistics |
| Top Talkers | Devices generating the most traffic |
| Applications | Applications consuming the most bandwidth |
| Protocols | Protocol distribution breakdown |
| Threats | Flow records associated with detected threat activity |
Traffic Volume Timeline
A time-series chart showing the volume of flow data collected over time.
Protocol Mix
A donut chart showing the relative proportion of traffic by protocol.
Collector Statistics
Shows the number of flows received, active collectors, and any suppressed flows.
Path Flows
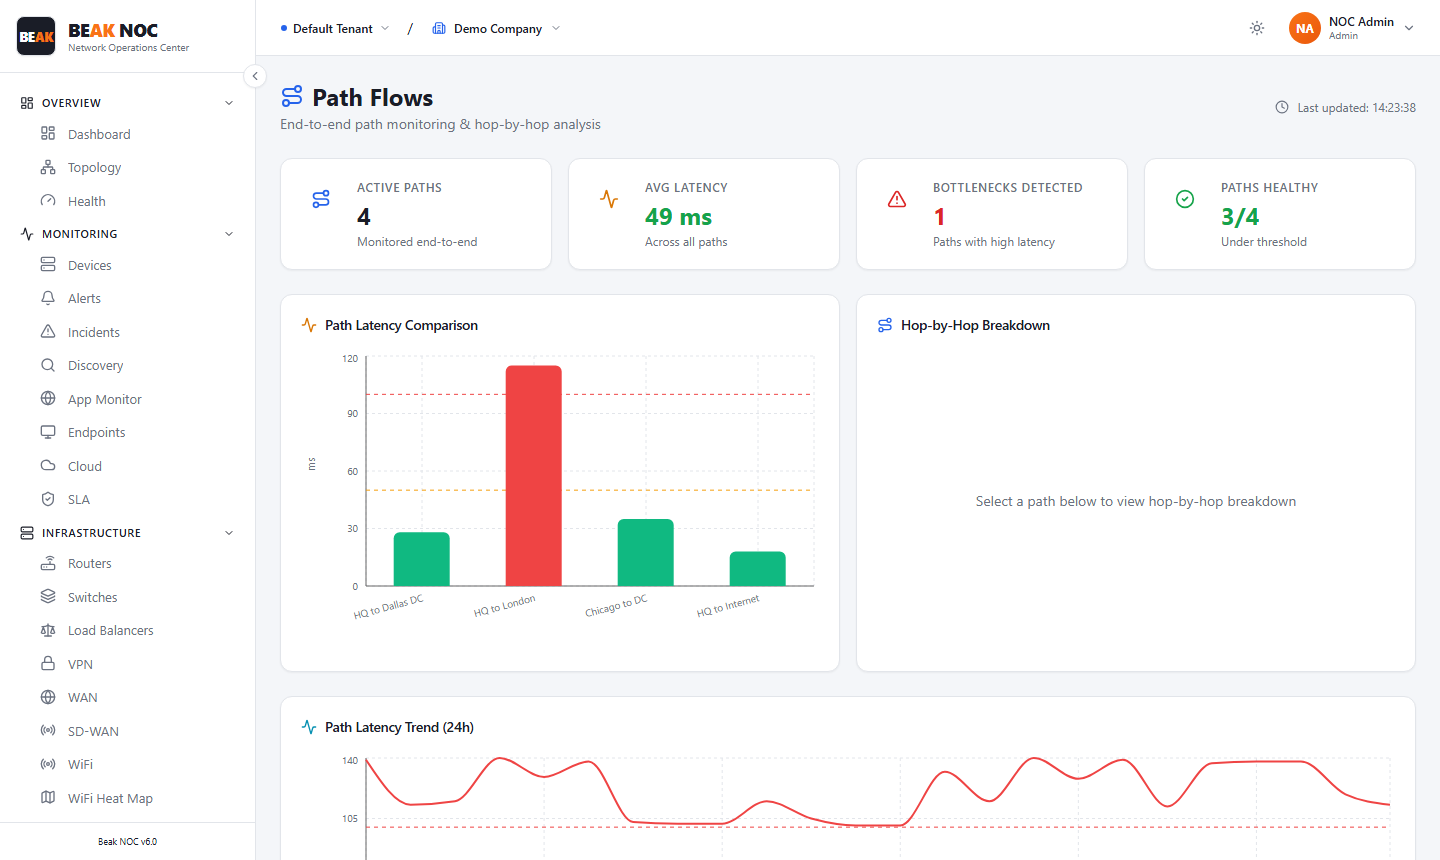
Path Flows provides end-to-end monitoring of specific network paths, measuring latency at each hop and identifying which segment is introducing delays.
Summary Cards
| Card | Description |
|---|---|
| Active Paths | Number of paths currently being monitored end-to-end |
| Avg Latency | Average latency across all monitored paths |
| Bottlenecks Detected | Count of paths where a single hop accounts for the majority of total latency |
| Paths with High Latency | Count of paths exceeding acceptable latency thresholds (e.g., 3/4) |
Path Latency Comparison
A bar chart comparing the total latency of each monitored path side by side.
Hop-by-Hop Breakdown
Select a path from the chart to view its hop-by-hop latency breakdown. Each hop shows its individual latency contribution.
Path Latency Trend (24h)
A time-series chart showing how the latency of each monitored path has varied over the last 24 hours.
Related Pages
- Packet Analysis — Deeper protocol and socket-level inspection
- Traffic — Per-device traffic volume
- Security — Threat flow correlation with security events