SLA Dashboard
The SLA Dashboard measures how well your network devices are meeting their availability commitments. It compares actual device uptime against a configurable SLA target — defaulting to 99.9% — and flags any device that has fallen below the threshold. Use this view to report on network reliability, identify chronic problem devices, and drive accountability for uptime.
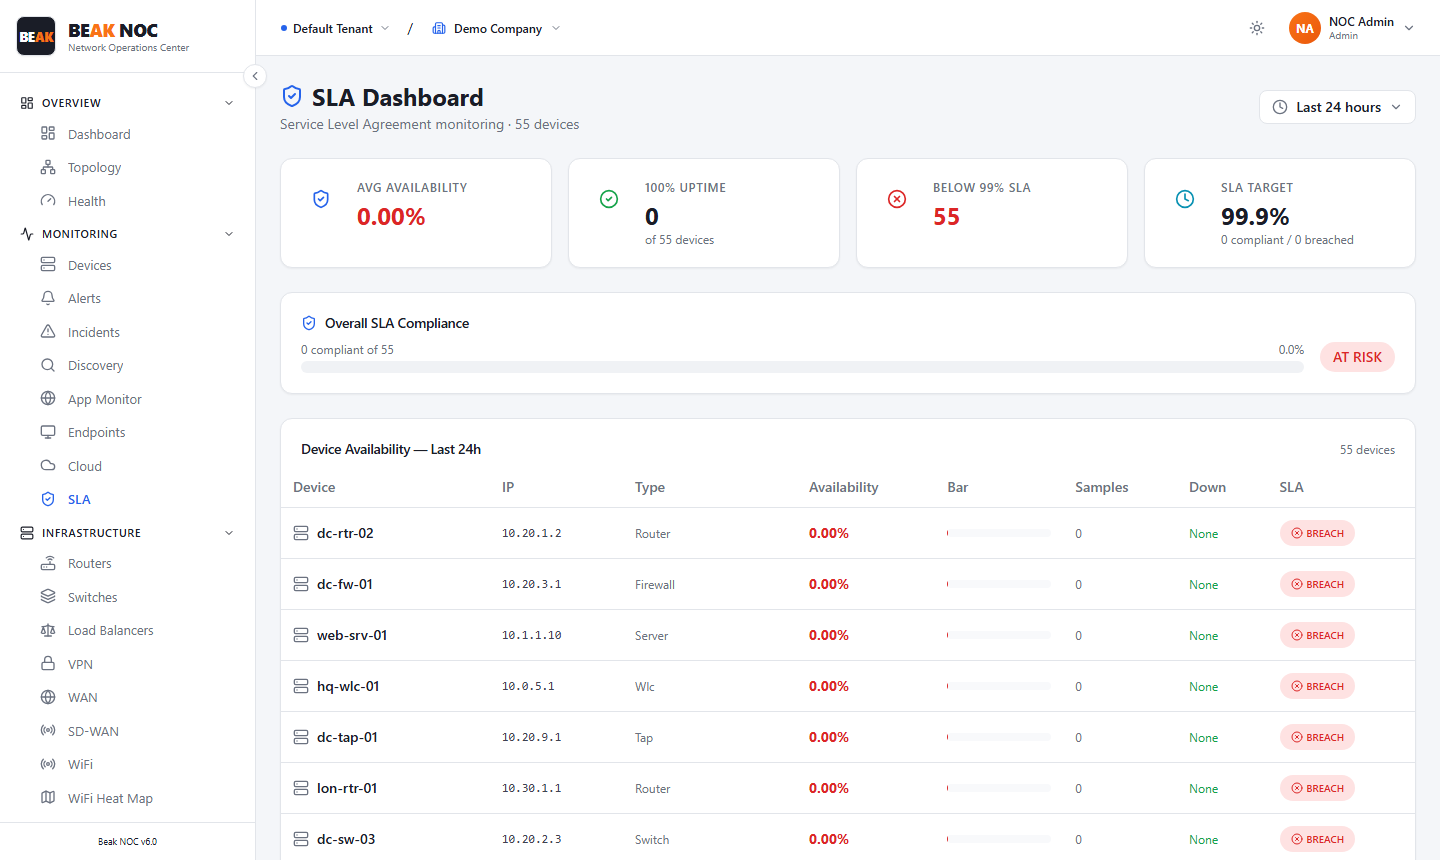
Summary Cards
Four KPI cards summarize the current SLA picture across all monitored devices:
| Card | Description |
|---|---|
| Avg Availability | The average availability percentage across all monitored devices for the selected time range |
| 100% Uptime | Count of devices that have had zero downtime in the selected period |
| Below 99% SLA | Count of devices whose availability has fallen below 99% — these require attention |
| SLA Target | The configured SLA threshold (default 99.9%), with compliant and breached counts |
Time Range
Use the time range buttons in the top-right corner to change the analysis window:
| Option | Description |
|---|---|
| 24h | Last 24 hours |
| 3d | Last 3 days |
| 7d | Last 7 days |
| 30d | Last 30 days |
Changing the time range recalculates all availability percentages and SLA compliance immediately.
Device Availability Table
The Device Availability table shows per-device SLA data for the selected time range. Each row contains:
| Column | Description |
|---|---|
| Device | Device hostname — click to open the device detail view |
| IP | Management IP address |
| Type | Device type (Router, Switch, Firewall, etc.) |
| Availability | Uptime percentage for the selected time range |
| Bar | Visual availability bar — green for compliant, orange/red for degraded |
| Samples | Number of polling samples collected during the period |
| Down | Total time the device was unreachable during the period |
| SLA | Pass/Fail status against the configured SLA target |
Understanding Availability Calculation
Availability is calculated as:
Availability % = (Total time UP / Total time monitored) × 100
A device that was unreachable for 43 minutes in a 30-day period has an availability of approximately 99.9%. The Samples column shows how many polling intervals were included in the calculation — more samples means a more accurate result.
Related Pages
- Incidents — Incidents that caused downtime contributing to SLA degradation
- Alerts — Alerts triggered by device-down events
- Network Health — Overall network health scoring
- Reports — Export SLA data as PDF or CSV