Alerts
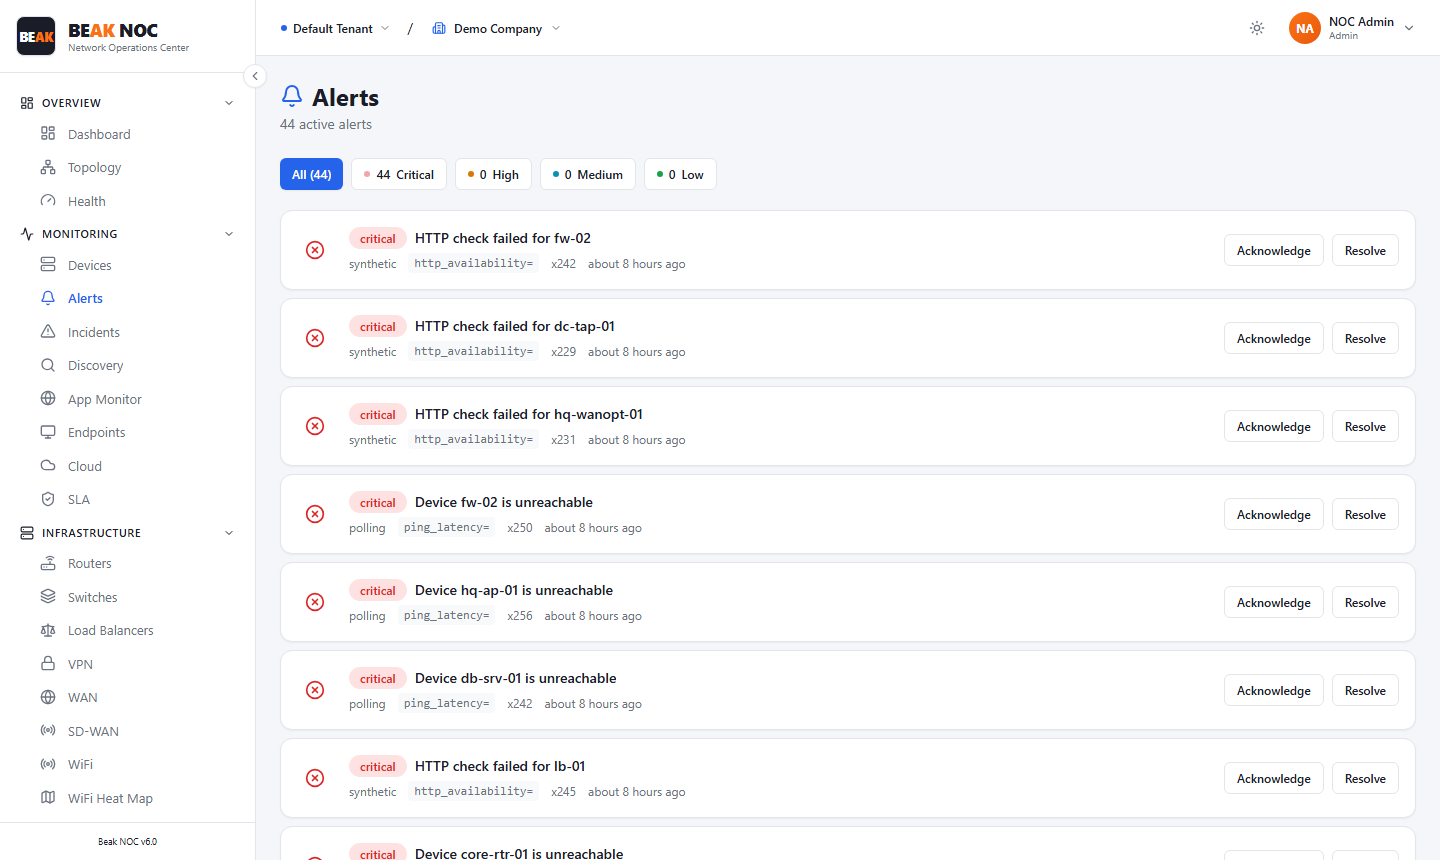
The Alerts page displays every active alert across your monitored network. Alerts are generated automatically when monitored devices or metrics breach configured thresholds. Use this page to triage active issues and drive them to resolution.
Severity Tabs
Alerts are organized by severity with a tab for each level. The count shown on each tab reflects the number of currently active alerts at that severity.
| Tab | Meaning |
|---|---|
| All | Shows every active alert regardless of severity |
| Critical | Service-affecting conditions requiring immediate action |
| High | Significant issues that may escalate if not addressed |
| Medium | Non-critical conditions that warrant investigation |
| Low | Informational alerts and minor threshold breaches |
Alert List
Each alert entry in the list includes the device name, alert description, severity indicator, time triggered, and action buttons — Acknowledge and Resolve — on the right of each row.