Vendor Dashboard
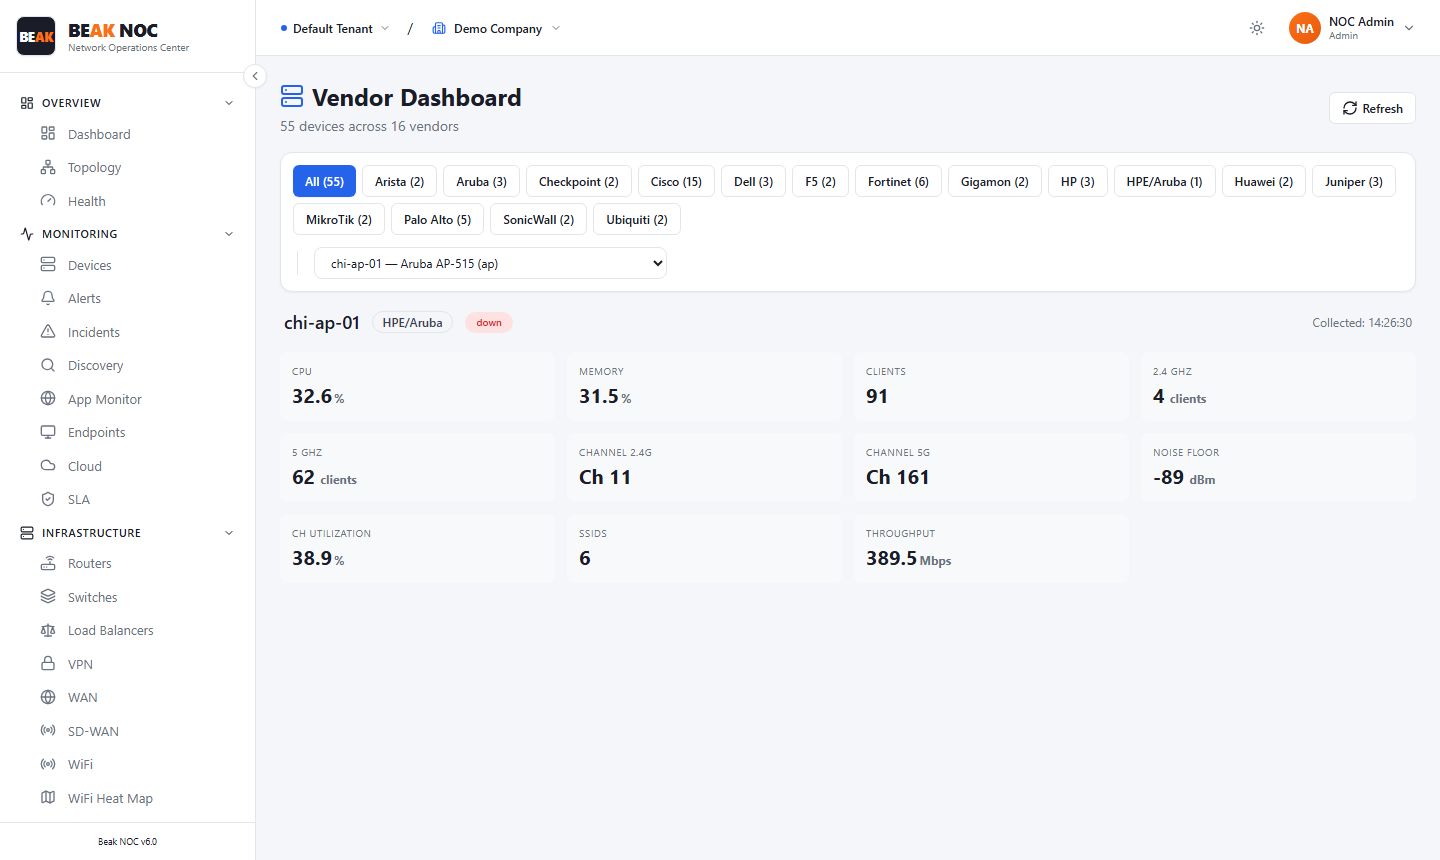
The Vendor Dashboard provides a device-centric monitoring view that adapts to the specific vendor and model of the selected device. Where the standard device view shows generic metrics (CPU, memory, interface bandwidth), the Vendor Dashboard surfaces vendor-specific OIDs and telemetry that are only meaningful for a particular device type — such as Cisco hardware health sensors, Juniper routing engine details, Fortinet VPN session counts, or Palo Alto firewall policy hit rates.
How It Works
Select a device from the device selector at the top of the page. Beak NOC reads the device's SNMP system description and OID fingerprint to determine its vendor, product family, and model. The dashboard then renders a layout of widgets appropriate for that specific device type.
This means a Cisco Catalyst switch shows port status summaries and VLAN tables, while a Palo Alto firewall shows session counts, threat logs, and policy statistics — all from the same Vendor Dashboard interface.
Supported Vendors
| Vendor | Device Types | Key Metrics Surfaced |
|---|---|---|
| Cisco | Routers, Switches, ASA Firewalls, Catalyst Center | Environmental sensors, EEM events, IOS version, EIGRP/OSPF neighbour state |
| Juniper | MX/EX/SRX/QFX series | Routing engine CPU, FPC health, MPLS LSP state, BGP peer state |
| Fortinet | FortiGate firewalls, FortiSwitch | VPN session count, UTM signatures version, HA sync state, CPU per core |
| Palo Alto | PA-series firewalls | Active sessions, threat counts, GlobalProtect users, license expiry |
| Aruba / HP | Access points, switches, controllers | AP association count, RF channel utilization, PoE power draw |
| Meraki | MX/MS/MR/MV series | Uplink status, client count, VPN peer state (via Meraki API) |
| Generic SNMP | Any SNMP-capable device | Standard MIB-II metrics (CPU, memory, interfaces) |
Vendor Dashboard Sections
The layout adapts per vendor, but common sections include:
Device Summary
High-level device health at a glance:
- Model — Vendor, product family, and hardware model
- Firmware / OS Version — Currently running software version
- Uptime — How long the device has been running since last reboot
- Serial Number — Hardware serial for asset tracking
Hardware Health
Environmental metrics pulled from vendor-specific MIBs:
- Temperature — Chassis and component temperatures with warning/critical thresholds
- Fan Status — Fan tray operational state (Normal/Failed)
- Power Supply — PSU state (Active/Standby/Failed)
- CPU per Core — Per-core utilization for multi-core devices (routers, firewalls)
Interface & Protocol Details
Vendor-enriched interface data beyond standard MIB-II:
- Error counters — Input/output errors, CRC errors, giants, runts
- Optical power levels — SFP Tx/Rx power (dBm) for fibre interfaces
- Routing protocol state — BGP peer count and state, OSPF neighbour adjacencies, EIGRP neighbours
Security & Session Metrics (Firewalls)
For firewall devices, the Vendor Dashboard adds:
- Active sessions — Current connection table utilization
- Threat events — Recent IPS/IDS detections with severity
- VPN tunnels — IPsec SA count and status
- Authentication — Failed login attempts
Selecting a Device
- Click the Select Device dropdown at the top of the page
- Search by device name or IP address
- Click the device to load its vendor-specific dashboard
The dashboard populates immediately with live data from the selected device.
Best Practices
- Use for deep-dive investigation — The Vendor Dashboard is best used after identifying a suspicious device via the main Devices view or PerfStack. It provides the detailed vendor context to understand exactly what is wrong.
- Monitor optical power levels on fibre links — Degrading SFP Tx power (especially on long-haul links) predicts fibre link failures days before the link actually drops.
- Track firmware versions — The Vendor Dashboard surfaces OS/firmware version per device. Use this to identify devices running outdated or vulnerable firmware that should be prioritised for update.
- Check BGP/OSPF neighbour state after any network change — Routing protocol state is visible here before it shows up as a reachability problem downstream.
Related Pages
- Devices — Device inventory with basic health and status for all monitored devices
- PerfStack — Multi-metric correlation using any vendor metric as an input
- Config Backup — Device configuration backup and drift detection
- Discovery — Adds new vendor devices to the monitored inventory