Cloud Monitoring
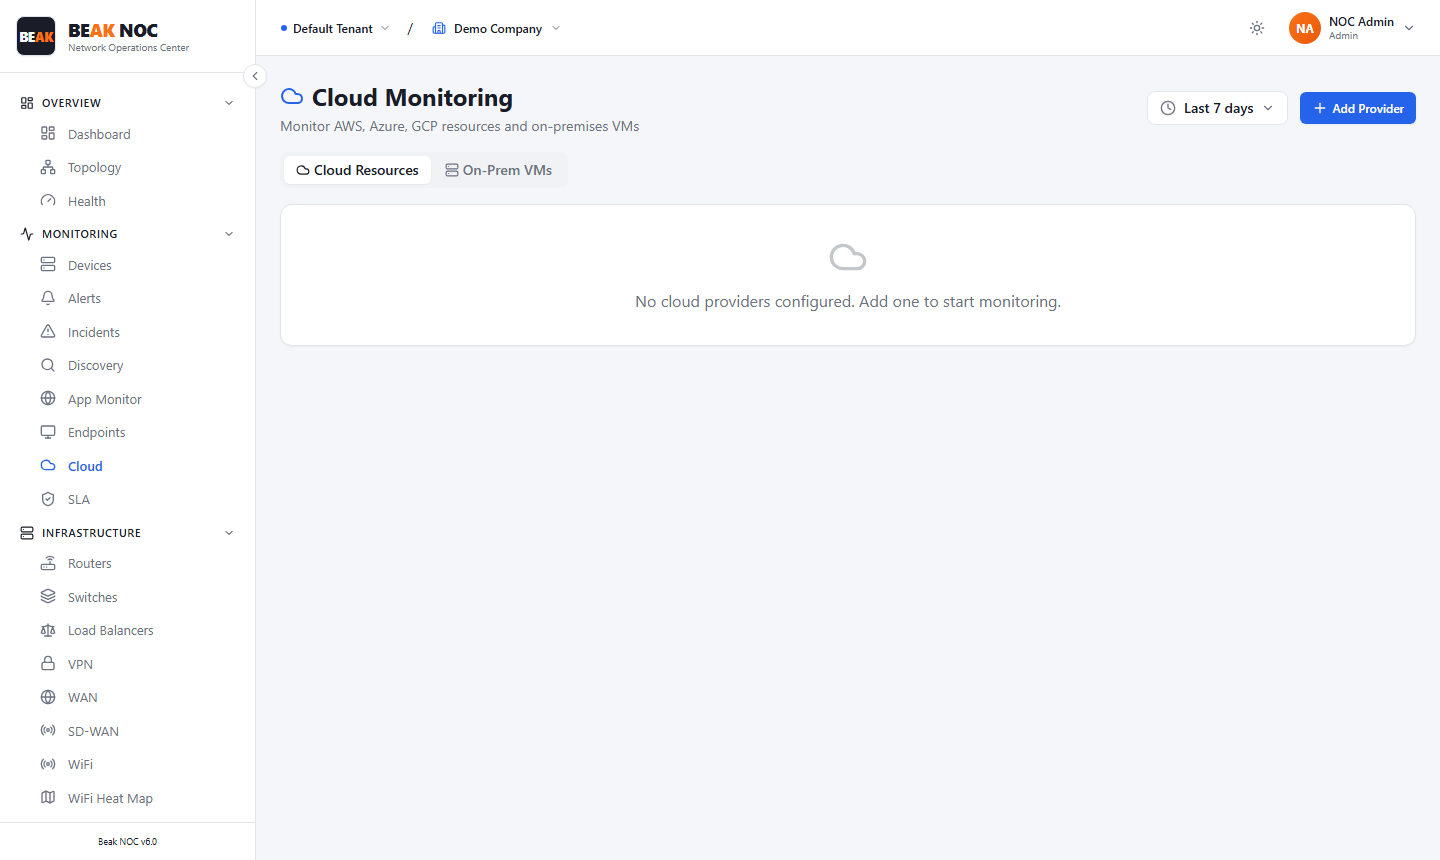
Beak NOC Cloud Monitoring integrates with major public cloud providers to bring cloud resource health into the same operational view as your on-premises network. Instead of context-switching between cloud consoles and your NOC, cloud resource status, instance health, and service availability are visible directly within Beak NOC.
Supported Cloud Providers
| Provider | Integration Method |
|---|---|
| AWS | IAM Role or Access Key / Secret Key with read-only permissions |
| Azure | Service Principal with Reader role on the target subscription |
| GCP | Service Account with Monitoring Viewer role |
Adding a Cloud Provider
Click Add Provider to connect a cloud account. The setup wizard steps through:
- Select Provider — Choose AWS, Azure, or GCP
- Credentials — Enter API credentials or configure role-based access
- Regions — Select which cloud regions to monitor (all regions or a subset)
- Resources — Choose which resource types to import (compute instances, load balancers, databases, Kubernetes clusters, etc.)
- Polling Interval — Set how frequently Beak NOC queries the cloud APIs for updated metrics
Once configured, cloud resources appear in the monitoring inventory alongside on-premises devices.
Cloud Resource Monitoring
Compute Instances
For each monitored VM or EC2/Azure VM/GCE instance:
- State — Running, Stopped, Terminated
- CPU Utilization — Average and peak CPU % over the monitoring period
- Network In/Out — Bytes transferred per the cloud provider's metrics
- Status Checks — Provider-level health checks (system status and instance status)
Cloud Services
Beyond compute, Beak NOC tracks the health of managed cloud services:
| Service Type | Examples |
|---|---|
| Load Balancers | AWS ALB/NLB, Azure Application Gateway |
| Databases | AWS RDS, Azure SQL, Cloud SQL |
| Storage | S3 bucket availability, Azure Blob errors |
| Kubernetes | Node readiness, pod failure counts |
Cloud Alerts
Cloud-native alerts (AWS CloudWatch Alarms, Azure Monitor Alerts) are ingested and unified into the Beak NOC Alerts feed so all alerts — cloud and on-premises — appear in a single queue.
Unified Network + Cloud View
When a network issue affects cloud connectivity (for example, an SD-WAN tunnel to a cloud region goes down), Beak NOC correlates:
- The WAN/SD-WAN alert on the network side
- The increased error rate on the cloud load balancer
- The application availability drop in App Monitor
This unified view eliminates the need to manually correlate cloud console events with network events.
Best Practices
- Use read-only credentials — Beak NOC only requires read access to cloud APIs. Never grant write permissions to the monitoring integration.
- Monitor all regions where you have active workloads — Cloud providers isolate region-specific issues; a problem in
us-east-1may not be visible from metrics ineu-west-1. - Set instance-specific thresholds — A database server running at 80% CPU is normal during a batch job; the same utilization on an application server may indicate a problem.
- Review cloud alerts daily — Cloud-native alerts often have different definitions than network alerts. Review the alert taxonomy when first integrating a provider to avoid alert flood.
Related Pages
- App Monitor — Application-level monitoring for cloud-hosted applications
- SD-WAN — SD-WAN tunnel health for cloud on-ramp connections
- Alerts — Unified alert feed including cloud-native alerts
- Reports — Cloud resource availability included in monthly summary reports