Optimization Thresholds
Optimization Thresholds configures the levers that drive the License Optimization engine. Each threshold maps to one class of recommendation — adjust them to match your organization's tolerance for waste vs noise.
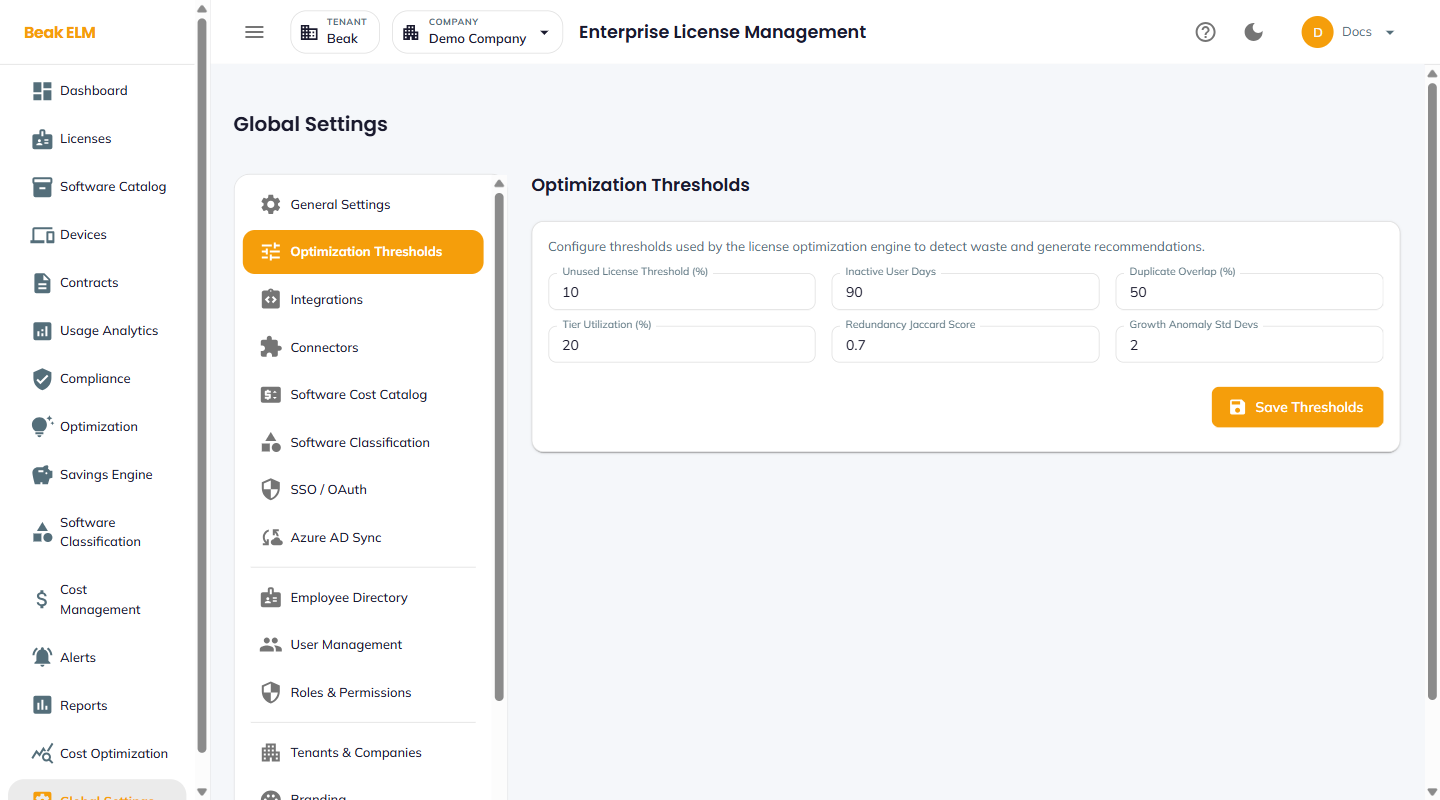
Thresholds
| Field | Default | Drives |
|---|---|---|
| Unused License Threshold (%) | 10 | A license is flagged Unused when utilization falls below this percent |
| Inactive User Days | 90 | A user with no activity for this many days is flagged Inactive User |
| Duplicate Overlap (%) | 50 | Two products are flagged Duplicate Tool when usage overlap exceeds this percent |
| Tier Utilization (%) | 20 | A user is flagged for Tier Mismatch (downgrade) when feature usage is below this percent |
| Redundancy Jaccard Score | 0.7 | Two tool catalogs are flagged redundant when their feature-set Jaccard similarity exceeds this score |
| Growth Anomaly Std Devs | 2 | A license-count growth above this many standard deviations from the rolling baseline is flagged anomalous |
The Save Thresholds button persists the values; the change applies on the next Run Optimization pass.
Best Practices
- Start at defaults and tune per organization — a company with predictable seasonal seat fluctuations may need a higher
Growth Anomaly Std Devs(e.g.3) to suppress quarterly true-up noise. - Drop
Inactive User Daysto60for high-cost SaaS (e.g. Salesforce, Snowflake) and keep it at90for low-cost desktop tools — most reclaim value comes from the high-cost category. - A
Duplicate Overlap %of50is a starting point; tune up to70if the engine produces too manyDuplicate Toolrecommendations that turn out to be intentional redundancy. - Re-run
Run Optimizationfrom the Optimization page after any threshold change so the queue reflects the new values.
Related Pages
- License Optimization — Recommendations driven by these thresholds
- Usage Analytics — Underlying utilization data