Dashboard
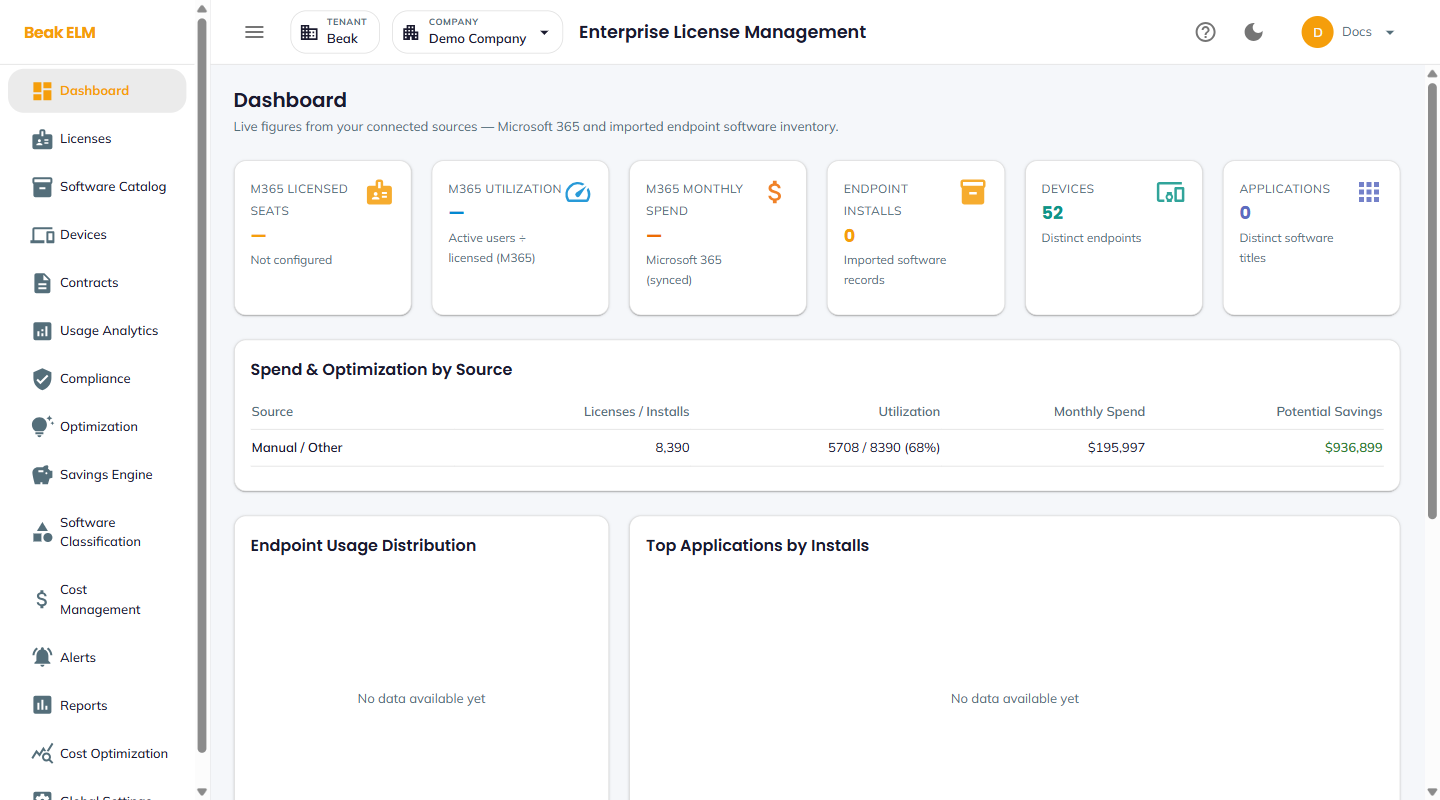
The Dashboard is the executive landing page for Beak ELM. It surfaces live figures from your connected sources — Microsoft 365 and imported endpoint software inventory — across six KPI tiles, a per-source spend and optimization table, and three endpoint inventory charts.
KPI Tiles
The header strip surfaces six tenant-level metrics for the active company.
- M365 Licensed Seats — Total licensed seats synced from Microsoft 365; shows
Not configureduntil the M365 integration is connected - M365 Utilization — Active users ÷ licensed seats from the M365 sync
- M365 Monthly Spend — Monthly Microsoft 365 spend (synced)
- Endpoint Installs — Imported software records from endpoint inventory
- Devices — Distinct endpoints discovered
- Applications — Distinct software titles discovered
Note: A dash (
—) on an M365 tile means the Microsoft 365 integration isn't configured yet for the active company. The endpoint tiles read0until an RMM export or connector sync populates the Endpoint Inventory.
Spend & Optimization by Source
A breakdown of every data source feeding the inventory, with one row per connector or manual entry.
| Column | Description |
|---|---|
| Source | Connector identifier (e.g. Manual / Other, RMM Software Inventory) |
| Licenses / Installs | License count (or install count for endpoint sources) attributed to this source |
| Utilization | Aggregate assigned / active across this source's licenses, or the install usage split for endpoint sources |
| Monthly Spend | Sum of monthly cost for this source |
| Potential Savings | Sum of monthly savings from open optimization recommendations attributed to this source |
A connector with Configured — no data yet has been wired up but hasn't returned its first sync.
Endpoint Inventory Charts
Three charts summarize the imported endpoint software inventory — the same data explored in depth on the Endpoint Inventory page.
- Endpoint Usage Distribution — Installs grouped by how recently they were last used
- Top Applications by Installs — Bar ranking of the most-deployed software titles
- Top Publishers by Installs — Bar ranking of publishers by install count
Each chart shows No data available yet until endpoint inventory is imported from the RMM connector or a CSV upload.
Best Practices
- Use the dashboard as the daily standing review for procurement and finance —
M365 Monthly SpendandPotential Savingsare the headline numbers for portfolio health. - The
Spend & Optimization by Sourcetable is the fastest way to spot a connector that has stalled — a row labelledConfigured — no data yetafter several days means a sync issue. - If the M365 tiles show
Not configured, wire up the Microsoft 365 integration first — most of the dashboard's live figures come from that sync. - Pair
Top Applications by Installswith the Endpoint Inventory usage buckets to turn install counts into reclaim candidates.
Related Pages
- Licenses — Full license inventory
- Endpoint Inventory — Install-level endpoint software data
- Optimization — Recommendations behind
Potential Savings - Cost Management — Detailed spend with vendor, category, and department views