Usage Analytics
The Usage Analytics page measures how licenses and software are actually being consumed. Four top-level tabs cover the four data sources — License Usage for the license inventory, Endpoint Software for install-level endpoint data, Microsoft 365 for synced M365 usage, and Smartsheet for Smartsheet seat usage.
License Usage
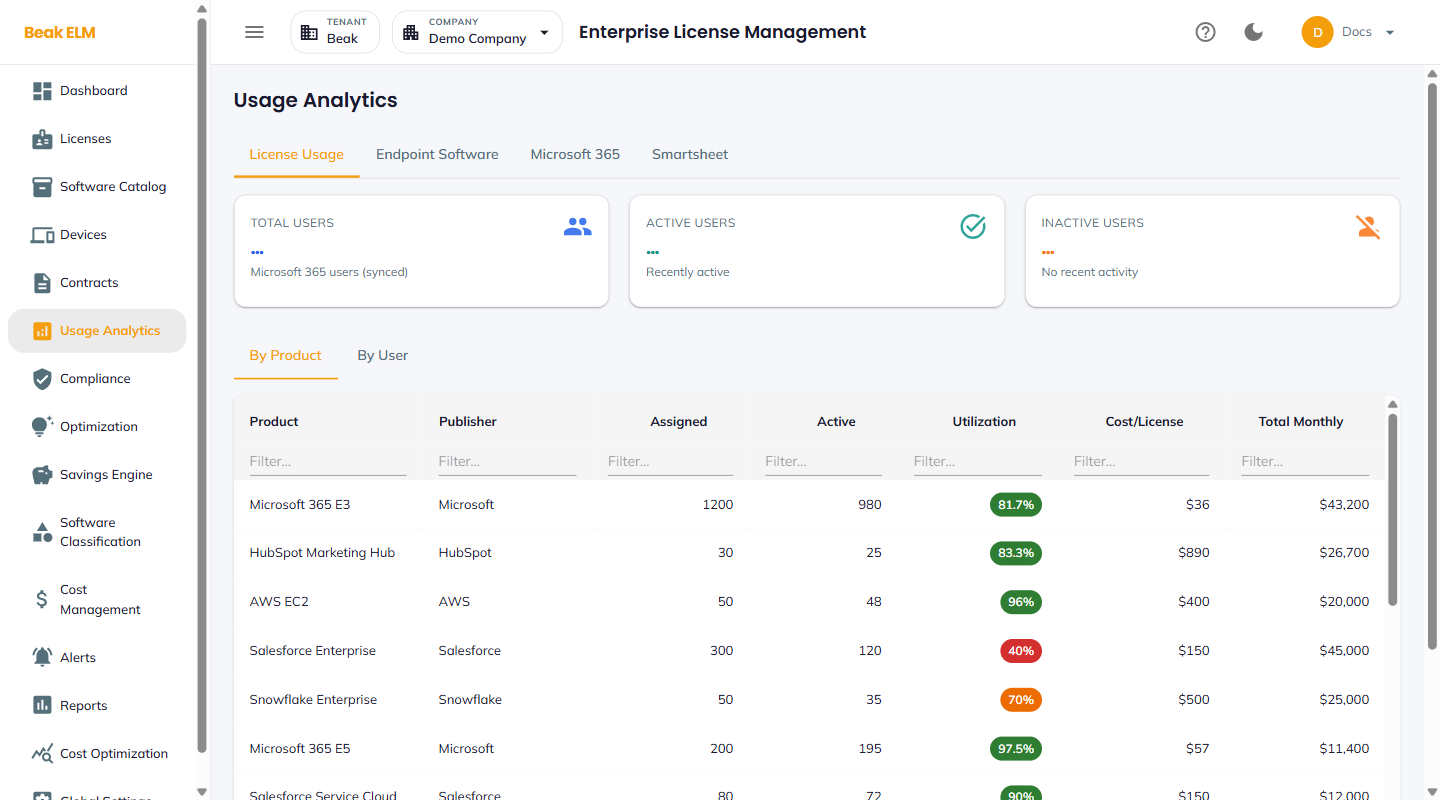
The default tab. KPI tiles roll up user activity synced from Microsoft 365; two sub-tabs (By Product, By User) drill into license consumption.
- Total Users — Microsoft 365 users (synced)
- Active Users — Users with recent activity
- Inactive Users — Users with no recent activity (threshold from Optimization Thresholds)
Note: A dash (
-) on a KPI means the Microsoft 365 integration isn't connected for the active company — theBy Producttable still populates from the license inventory independently.
By Product
One row per product with publisher, assignment, activity, utilization, and monthly cost. A Filter… box under each column header narrows the table by that column's values, and the filters compose.
| Column | Description |
|---|---|
| Product | Software product (e.g. Microsoft 365 E3, Salesforce Enterprise) |
| Publisher | Vendor (e.g. Microsoft, Salesforce, AWS) |
| Assigned | Seats currently assigned |
| Active | Seats with recent activity |
| Utilization | Active / Assigned — color-coded (green ≥ 80%, amber 40–80%, red < 40%) |
| Cost/License | Monthly cost per seat |
| Total Monthly | Monthly cost for this product across the company |
Utilization color cues are the fastest way to spot over-provisioned products — a red 40% row is a candidate for reclaim in Optimization.
By User
A tabular breakdown of each licensed user — name, email, status, assigned licenses, and last activity — with an Inactive only toggle. Use this to identify candidates for the Inactive Users report in Reports. The table populates from users synced by the Microsoft 365 integration.
Endpoint Software
The Endpoint Software tab embeds the full Endpoint Inventory view — install-level software discovered across your endpoints by the RMM connector, with usage classification buckets, insights charts, and drill-down tables. See Endpoint Inventory for the complete breakdown.
Microsoft 365
The Microsoft 365 tab surfaces per-subscription and per-user usage synced from the M365Lite service. It requires the Microsoft 365 integration to be configured, including the SSO Signing Secret shared with the M365Lite side — until then the tab shows a configuration prompt.
Smartsheet
The Smartsheet tab surfaces Smartsheet seat and usage data pulled by the Smartsheet connector. It requires that connector to be configured for the active company — until then it reports Smartsheet connector is not configured for this company. Connectors are scoped per company, so configure it for each company you want covered. See Connectors.
Best Practices
- Sort the
By Producttab byTotal Monthlydescending and review the utilization color of the top rows — a red high-spend row is the highest-leverage reclaim conversation. - Use the
Inactive onlytoggle onBy Userto drive a recurring cleanup workflow — pair it with theInactive Usersreport in Reports. - Connect the Microsoft 365 integration before relying on the KPI tiles — user activity data comes from the M365 sync.
- Use the per-column
Filter…boxes onBy Productrather than the search box when narrowing by publisher or utilization band — they compose, so several conditions can be applied at once.
Related Pages
- Licenses — Underlying license records
- Endpoint Inventory — Full endpoint software inventory and usage
- Optimization — Recommendations driven by usage data
- Cost Management — Spend rollups that pair with usage rollups