Switch Monitoring
Switch Monitoring provides comprehensive visibility into the health and performance of every managed switch in your environment. It goes beyond link up/down status to track CPU and memory utilisation trends, per-port traffic and error statistics, MAC address table sizes, Spanning Tree Protocol (STP) topology state, and Power over Ethernet (PoE) consumption — giving your NOC team the data needed to identify congestion, misconfiguration, and capacity issues before users are impacted.
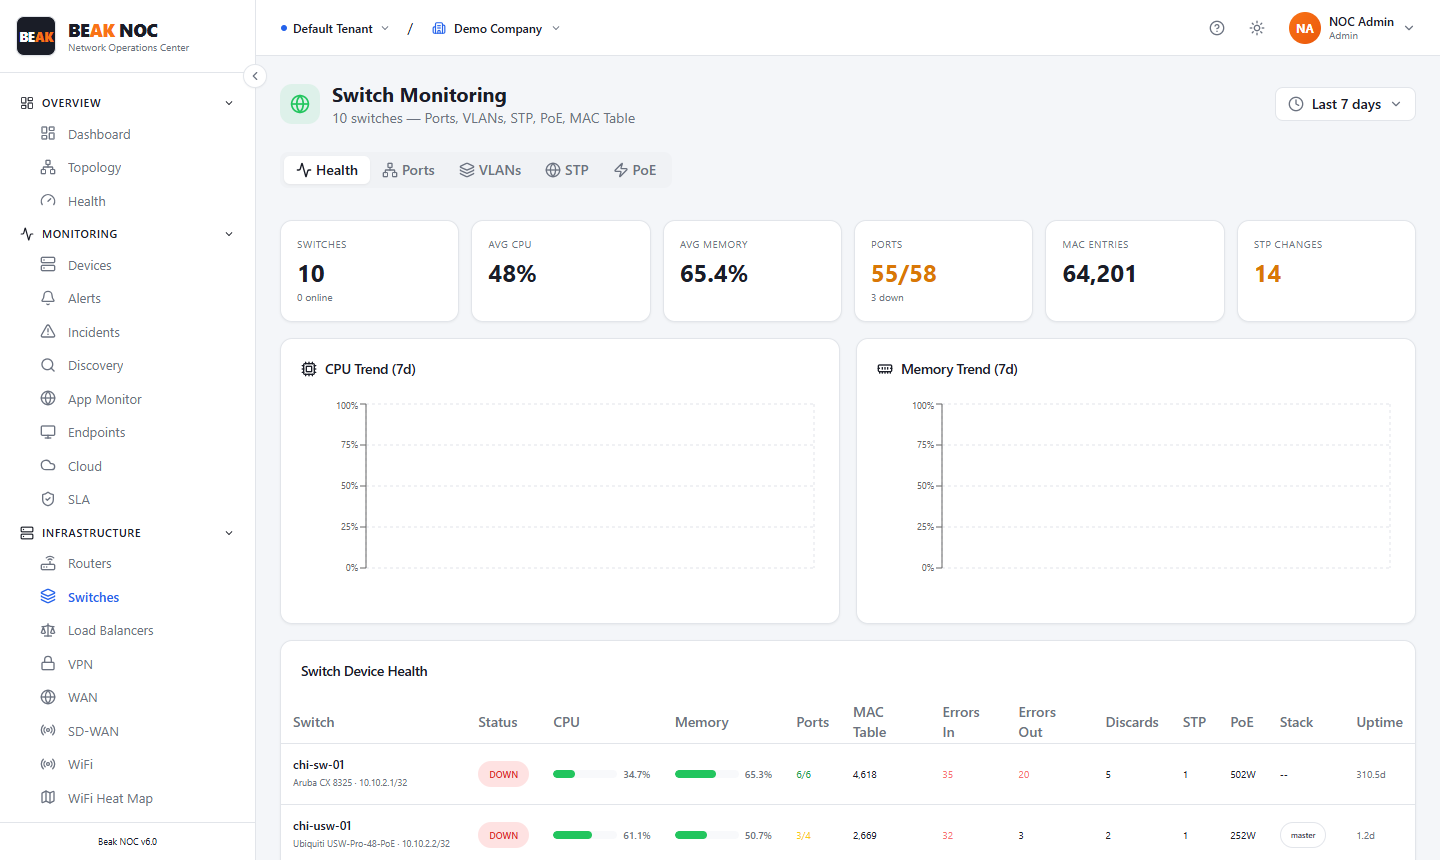
Summary Cards
| Card | Description |
|---|---|
| Switches | Total count of managed switches under monitoring |
| CPU | Average CPU utilisation across the switch fleet |
| Memory | Average memory utilisation across all switches |
| Ports | Count of active ports (online/total across all switches) |
| MACs | Total MAC addresses learned across all switch MAC address tables |
| Errors | Total port error count across all switches in the current period |
Tabs
| Tab | Description |
|---|---|
| Health | CPU and memory trend charts with per-device health table |
| Ports | Per-port traffic, utilisation, errors, and discards |
| VLANs | VLAN membership and traffic breakdown per switch |
| STP | Spanning Tree topology — root bridges, port roles, and topology change events |
| PoE | Power over Ethernet consumption per port and per switch |
| Poll | Last poll timestamps and SNMP poll health per device |
Trend Charts
CPU Trend (7d)
A 7-day time-series chart of average CPU utilisation across the switch fleet. Sustained high CPU on switches can delay STP processing, slow MAC learning, and impact control plane stability.
Memory Trend (7d)
A 7-day time-series chart of memory utilisation. Very large MAC address tables or extensive ACL lists can consume significant memory on older hardware.
Switch Device Health Table
| Column | Description |
|---|---|
| Switch | Device hostname or identifier |
| Status | Online or Offline |
| CPU | Current CPU utilisation percentage |
| Memory | Current memory utilisation percentage |
| Ports | Active port count |
| MACs | Total MAC addresses in this switch's table |
| Errors | Cumulative input/output error count across all ports |
| Discards | Dropped packets due to queue overflow or congestion |
| STP | STP role — Root Bridge or Non-Root; topology change event count |
| PoE | Total PoE wattage in use (if the switch supports PoE) |
| Load | Aggregate bandwidth utilisation across all switch ports |
Ports Tab
The Ports tab lists every port across all monitored switches:
| Column | Description |
|---|---|
| Port | Interface name (e.g., GigabitEthernet1/0/1) |
| Switch | Parent switch device |
| Status | Up, Down, or Administratively Down |
| Speed | Negotiated port speed |
| VLAN | Access VLAN or trunk designation |
| In/Out | Current utilisation in Mbps |
| Errors | Input and output error count |
| Discards | Dropped packet count |
STP Tab
The STP tab shows Spanning Tree topology state across the network:
- Root Bridge — Which switch is acting as root per VLAN
- Port Roles — Root Port, Designated Port, Blocking, Listening, Learning for each port
- Topology Changes (TCN) — Count of topology change notifications in the monitoring period. Frequent TCNs can cause flooding and performance degradation.
- Root Path Cost — Cost from each switch to the root bridge
Note: A high topology change count often indicates a flapping port or a misconfigured edge port without PortFast enabled.
PoE Tab
For switches with PoE support, the PoE tab shows:
| Column | Description |
|---|---|
| Port | PoE-capable port |
| Device | Connected PD (Powered Device) — e.g., IP phone, AP, camera |
| Class | PoE class (0–8) indicating power draw category |
| Current (W) | Current wattage being delivered |
| Max (W) | Maximum available power for this port |
| Status | Delivering, Searching, Fault |
Monitor total switch PoE budget utilisation to avoid oversubscription, which can cause PoE ports to power cycle.
Best Practices
- Alert on port error rate increases — A port logging more than 1% input errors is likely experiencing a physical layer problem. Check cable, SFP, and duplex settings.
- Watch STP topology changes — More than a few TCNs per hour indicates an unstable port. Enable PortFast on edge ports (end devices, not switch-to-switch links) to prevent unnecessary topology events.
- Manage MAC table capacity — Switches with MAC tables near capacity will start flooding traffic, causing a significant performance hit. Upgrade hardware or segment the network if tables are consistently above 80%.
- Monitor PoE budget — As more PoE devices (APs, cameras, phones) are added, track cumulative wattage per switch. Approaching the budget limit requires either reducing load or adding a PoE injector.
Related Pages
- VLANs — VLAN traffic analysis across the switch fabric
- Network Devices — Switches in the unified device inventory
- Network Topology — Physical switch interconnections in the topology map
- Alerts — Switch health and port error alerts in the alert feed