Router Monitoring
Router Monitoring gives your NOC team deep visibility into the operational health of every router in your network. Beyond simple up/down status, it tracks CPU and memory utilisation over time, interface states, routing protocol adjacencies (BGP, OSPF), route table sizes, and latency — enabling proactive identification of performance degradation before it impacts traffic.
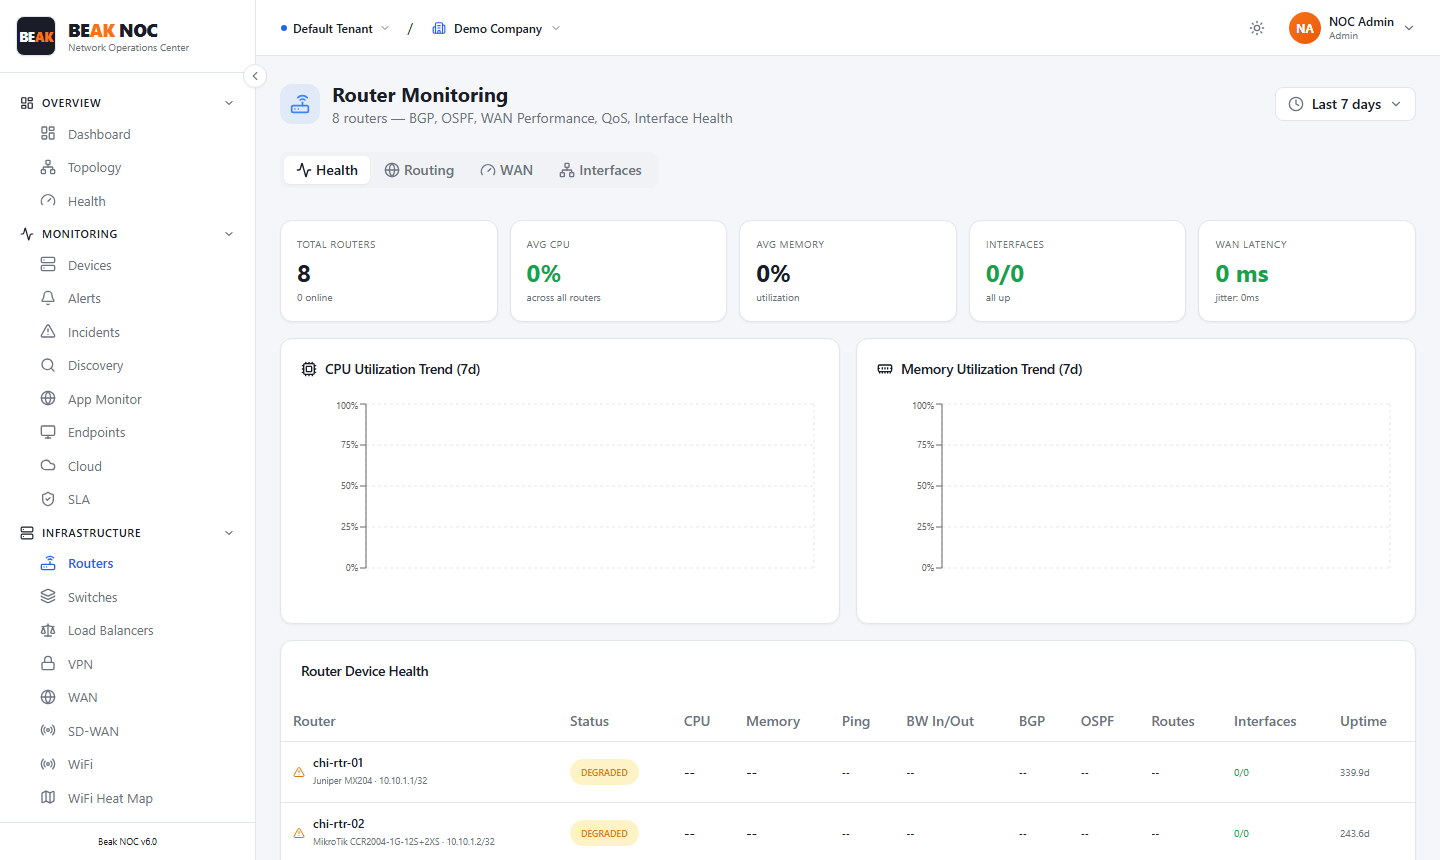
Summary Cards
| Card | Description |
|---|---|
| Routers | Total count of routers under monitoring |
| CPU | Average CPU utilisation across all routers in the fleet |
| Memory | Average memory utilisation across all routers |
| Interfaces | Count of monitored interfaces (online/total) |
| Latency | Average round-trip latency to all monitored routers in milliseconds |
Tabs
| Tab | Description |
|---|---|
| Health | CPU and memory trends with per-device health table |
| Routing | BGP and OSPF adjacency status, route counts, and routing protocol health |
| ITSM | Open incidents and change requests linked to router devices |
| Interfaces | Per-interface traffic, errors, and utilisation for all router interfaces |
Trend Charts
CPU Utilisation Trend (7d)
A time-series area chart showing average CPU utilisation across the router fleet over the last 7 days. Peaks that correlate with known maintenance windows or traffic events help distinguish expected behaviour from anomalies.
Memory Utilisation Trend (7d)
A time-series area chart tracking memory utilisation over the last 7 days. Gradual memory growth without recovery (sawtooth pattern missing the downward phase) may indicate a memory leak in the router OS.
Router Device Health Table
The main table lists every monitored router with:
| Column | Description |
|---|---|
| Router | Device hostname or identifier |
| Status | Online or Offline based on last SNMP poll |
| CPU | Current CPU utilisation percentage |
| Memory | Current memory utilisation percentage |
| Ping | Round-trip latency in milliseconds |
| BW In/Out | Current inbound and outbound bandwidth on the primary interface |
| BGP | Number of BGP peers and their adjacency state (Established / Down) |
| OSPF | OSPF adjacency count and state |
| Routes | Total routes in the routing table |
| Interfaces | Count of active interfaces on the device |
| Options | Drill into device details, interface list, or routing table |
Routing Tab
The Routing tab provides protocol-level detail:
- BGP Peers — Lists each BGP peer with remote AS, peer state, prefixes received/sent, and uptime since last state change
- OSPF Neighbours — Lists OSPF neighbours with area, state, and time since last hello
- Route Count — Total IPv4 and IPv6 routes, broken down by protocol (connected, static, BGP, OSPF)
A BGP peer in Idle or Active state warrants immediate investigation, as it indicates routing adjacency is lost.
Interfaces Tab
The Interfaces tab provides per-interface metrics for all routers:
| Column | Description |
|---|---|
| Interface | Interface name (e.g., GigabitEthernet0/0) |
| Device | Parent router |
| Status | Up or Down |
| Speed | Configured interface speed |
| In/Out | Current utilisation in Mbps or Gbps |
| Errors | Input/output error count |
| Discards | Dropped packets due to queue overflow |
Best Practices
- Alert on BGP peer state changes — A BGP peer drop can cause large-scale routing changes. Configure alerts for any peer leaving the
Establishedstate. - Watch for CPU above 70% — High CPU on routers can delay OSPF hello processing and cause adjacency drops. Investigate what process is consuming CPU (e.g., route calculations, logging).
- Monitor route table growth — An unexpectedly large route count may indicate a route leak. Cross-reference BGP prefix counts per peer.
- Track interface error rates — Input errors on a router interface often indicate a physical layer problem (duplex mismatch, bad cable, failing SFP) — inspect before errors accumulate.
Related Pages
- Network Devices — Routers appear in the unified device inventory with SNMP details
- Network Flows — Traffic flows through routers visible in flow analysis
- Alerts — Router health alerts in the unified alert feed