Load Balancer Monitoring
Load Balancer Monitoring provides real-time visibility into the health and performance of your load balancing infrastructure. It surfaces the metrics that matter most for application delivery — active connections, requests per second (RPS), SSL/TLS processing rates, pool member availability, and hardware resource utilisation — so your NOC team can detect saturation, failed pool members, and certificate issues before applications degrade.
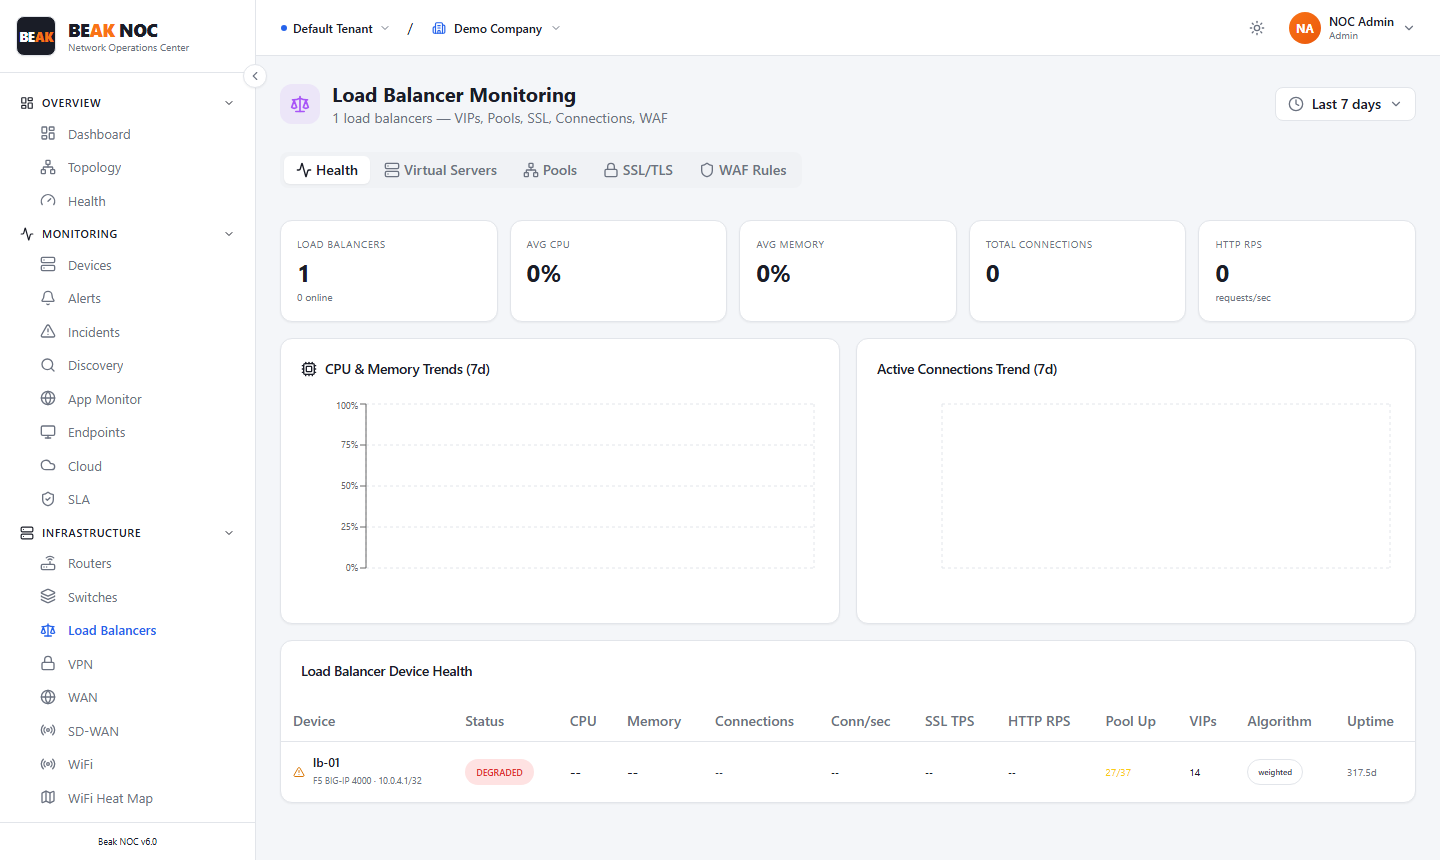
Summary Cards
| Card | Description |
|---|---|
| Virtual Servers | Total count of virtual servers (VIPs) configured across all load balancers |
| CPU | Average CPU utilisation across all load balancer devices |
| Memory | Average memory utilisation across all load balancers |
| L-connections | Total active Layer 4/Layer 7 connections across all virtual servers |
| RPS | Aggregate requests per second being processed across all virtual servers |
Tabs
| Tab | Description |
|---|---|
| Health | CPU and memory trend charts with per-device health table |
| Virtual Pools | Pool member status, health check results, and traffic distribution |
| SSL/TLS | SSL offload throughput, certificate status, and TLS version breakdown |
| WAF Rates | Web application firewall event rates (if WAF module is active) |
Trend Charts
CPU & Memory Trends (7d)
A 7-day dual-line chart comparing CPU and memory utilisation. Load balancers performing SSL offload typically show CPU and memory co-movement during peak traffic. A divergence (CPU normal, memory growing) may indicate a connection leak.
Active Connections Trend (7d)
A 7-day time-series chart of concurrent active connections. Helps identify traffic patterns, peak hours, and unexpected connection spikes that could indicate an attack or application malfunction.
Load Balancer Device Health Table
| Column | Description |
|---|---|
| Device | Load balancer hostname or identifier |
| Status | Online or Offline |
| CPU | Current CPU utilisation percentage |
| Memory | Current memory utilisation percentage |
| L-connections | Current active connection count |
| Conn/s | New connections being established per second |
| SSL TPS | SSL handshakes processed per second (SSL offload rate) |
| HTTPS RPS | HTTPS requests per second |
| Pool Up | Ratio of pool members currently passing health checks (e.g., 8/10) |
| VIPs | Count of virtual IP addresses configured |
| Algorithm | Load balancing algorithm in use (Round Robin, Least Connections, IP Hash, etc.) |
| Options | Drill into virtual server detail, pool member list, or connection table |
Virtual Pools Tab
The Virtual Pools tab shows the health of backend server pools:
| Column | Description |
|---|---|
| Pool Name | Backend server pool identifier |
| VIP | Virtual IP this pool is assigned to |
| Members | Total pool members |
| Up | Members currently passing health checks |
| Down | Members currently failing health checks |
| Health Check | Protocol used (HTTP, HTTPS, TCP, ICMP) and last result |
| Distribution | How traffic is currently distributed across members (active connections per member) |
A pool member in the Down state means that the associated backend server is not receiving traffic. If all members in a pool are down, the VIP will return errors to clients.
SSL/TLS Tab
The SSL/TLS tab tracks certificate and encryption performance:
- SSL TPS — SSL handshakes per second — high values indicate heavy SSL offload load
- TLS Version Distribution — Breakdown of TLS 1.2 vs TLS 1.3 usage across connections
- Certificate Expiry — Status of SSL certificates bound to each virtual server
- Cipher Usage — Which cipher suites are negotiated most frequently
Best Practices
- Alert when pool members drop below threshold — If more than one pool member fails health checks simultaneously, investigate immediately. A
1/3pool ratio means remaining members absorb 3x normal load. - Monitor SSL TPS approaching hardware limits — SSL/TLS offload is CPU-intensive. When SSL TPS approaches the device's rated capacity, connection setup latency increases. Plan for capacity expansion.
- Track connections per second, not just active connections — A high Conn/s rate with a short connection lifetime (e.g., API traffic) can exhaust the connection table faster than long-lived connections.
- Investigate pool members with disproportionate connection counts — If one member in a Least Connections pool has significantly more connections than others, its health check may be passing while it is degraded. Add application-level health checks.
Related Pages
- Network Devices — Load balancers in the unified device inventory
- Security Operations Center — SSL/TLS certificate health feeding into security posture
- Network Flows — Traffic flow analysis for load-balanced applications
- Alerts — Pool member failure and device alerts in the alert feed