Cost Management
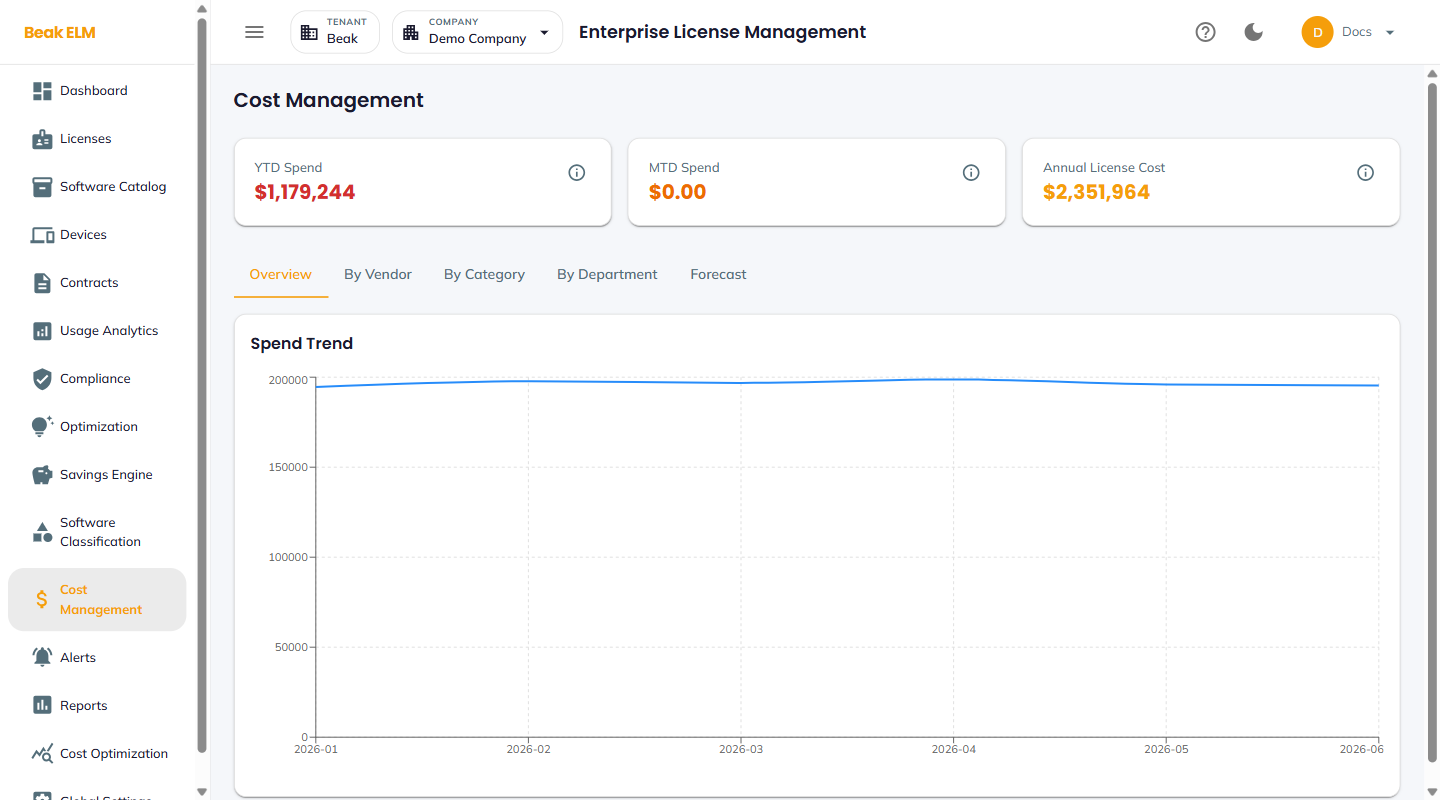
The Cost Management page rolls every annual license cost into period-aware spend metrics with five tab views. Three KPI tiles surface YTD, MTD, and total annual license cost; the tabs provide cuts of the same data by vendor, category, department, and a forecast band.
KPI Tiles
- YTD Spend — Year-to-date software spend across the active company
- MTD Spend — Month-to-date spend
- Annual License Cost — Sum of
annual_costacross active licenses
Overview
The default tab. A 12-month spend trend line chart — the same series rendered on the Dashboard. Hover to see the dollar value for each month and spot true-up months that diverge from the baseline.
By Vendor
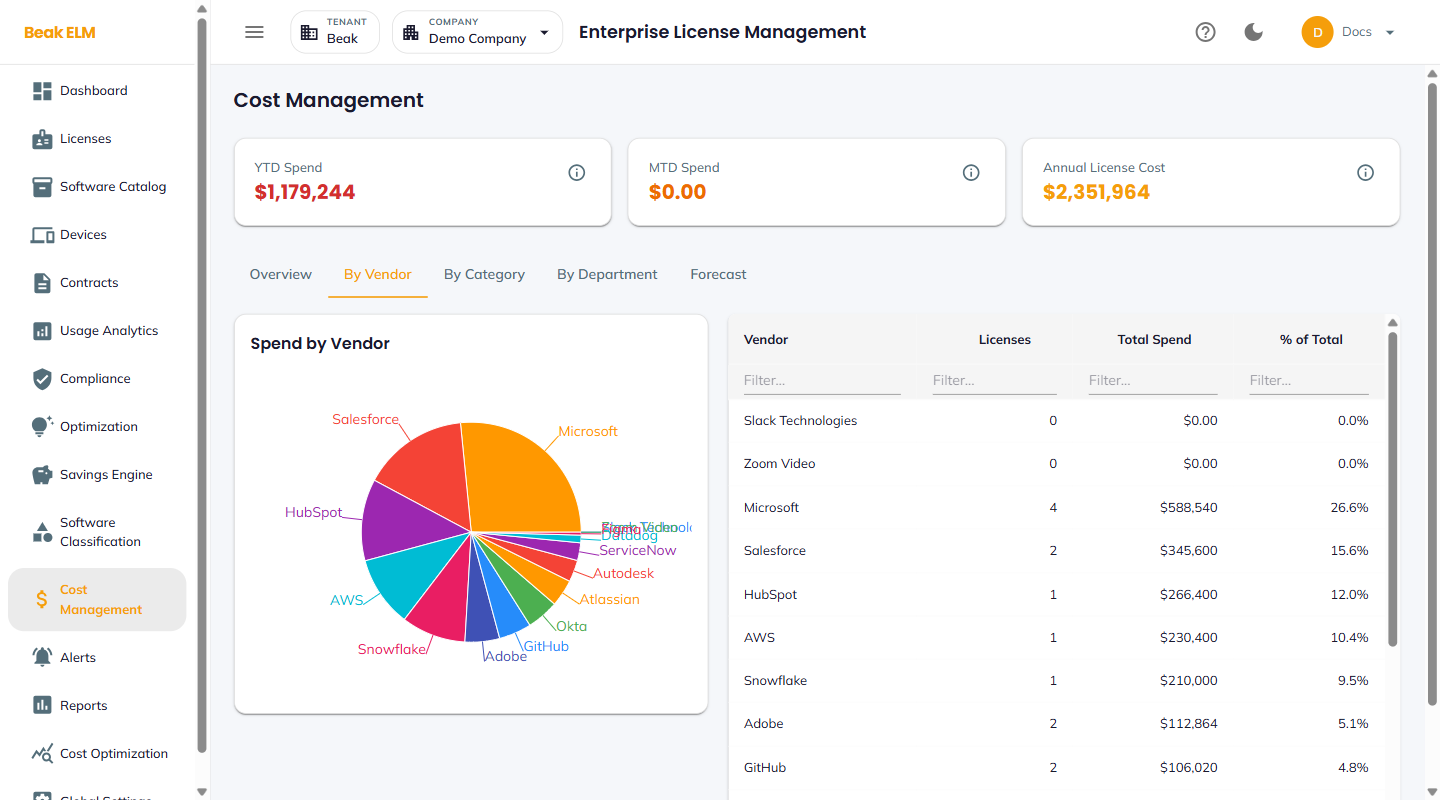
A pie chart on the left and a vendor-ranked table on the right.
| Column | Description |
|---|---|
| Vendor | Publisher (e.g. Microsoft, Salesforce, HubSpot) |
| Licenses | Number of license records bound to this vendor |
| Total Spend | Sum of annual cost across this vendor's licenses |
| % of Total | Vendor's share of total annual spend |
Vendors with 0 licenses and $0 typically appear when a contract exists but no licenses have been bound to it yet — surface these in the Contracts page for cleanup.
By Category
A pie chart and table grouping spend by category — SaaS, IaaS, desktop, etc. — using the Category field from the Software Catalog.
By Department
A bar chart grouping spend by employee department, driven by employee assignments. Use this to drive department chargebacks. The chart populates only when employees have a department field set (synced from Azure AD Sync or maintained in Employee Directory).
Forecast
A forecast band projecting the next 12 months of spend based on the current contract register, renewal dates, and historical trend. The shaded band is the upper / lower confidence interval; the central line is the expected spend.
Best Practices
- Compare
YTD Spendagainst last year's same period to spot creep — a YTD outpacing prior year by more than 10% usually indicates uncatalogued shadow IT. - Use
By Vendorto pre-stage renewal negotiations — vendors with the largest spend share are the highest-leverage conversations. - Review
By Departmentquarterly with finance — large department-to-spend imbalances often point to shadow IT or stranded seats. - Use
Forecast60 days before fiscal year-end to model true-up scenarios and budget asks for the next cycle.