Tenant Overview
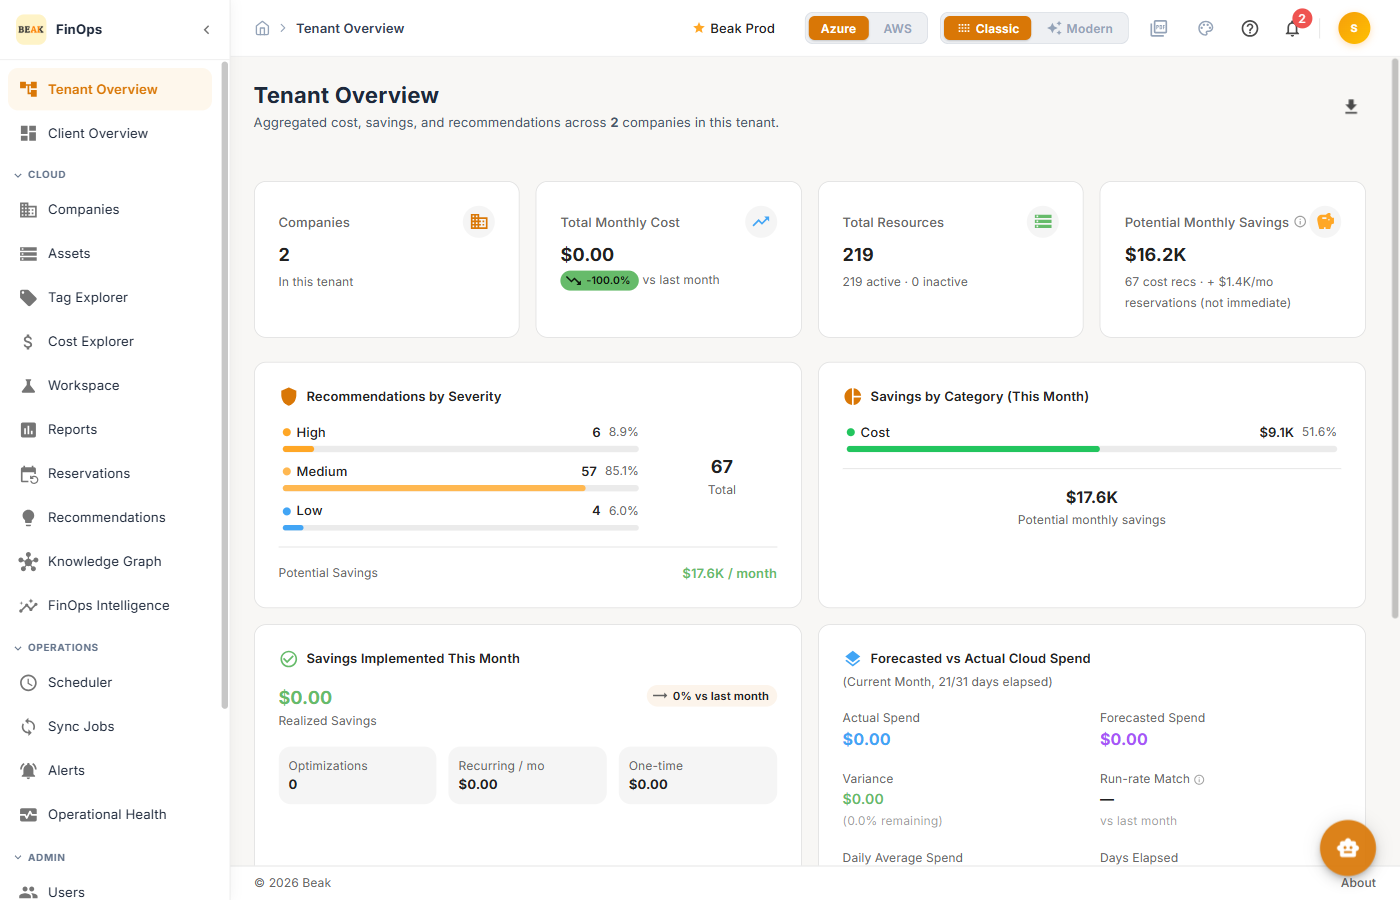
The Tenant Overview aggregates cost, savings, and recommendations across every company in your tenant — the fleet-wide view that sits above the per-company Client Overview. Use it to see total spend, where savings are concentrated, and how forecasted spend tracks against actuals for the whole organization.
Scope
The Tenant Overview is not scoped to a single company — there is no company selector in the header, only the tenant. It rolls up the numbers for all companies the tenant contains. The cloud toggle (Azure / AWS) still applies, and the view supports both Classic and Modern layouts.
Headline Tiles
- Companies — Number of companies aggregated in this tenant
- Total Monthly Cost — Combined month-to-date spend across all companies, with month-over-month change
- Total Resources — Combined resource count, split into active and inactive
- Potential Monthly Savings — Combined savings across all cost recommendations, plus projected reservation savings
Panels
- Recommendations by Severity — Open recommendations broken down by
High,Medium, andLow, with the total potential monthly saving - Savings by Category — Realizable savings split by type (for example Cost vs. Cleanup)
- Savings Implemented This Month — Realized savings to date, with optimization, recurring, and one-time breakdowns
- Forecasted vs Actual Cloud Spend — Actual spend, forecasted spend, variance, and run-rate match for the current month
Best Practices
- Start here for the monthly review — The Tenant Overview is the fastest way to brief stakeholders on total spend and savings across the organization
- Drill into a company — Switch a specific company from the Client Overview when a tenant-level number needs investigation
- Watch the run-rate match — A run-rate match well below 100% signals spend is trending away from forecast
Related Pages
- Client Overview — Per-company dashboard
- Cost Explorer — Detailed cost analysis
- Recommendations — Cost optimization opportunities
- Operational Health — Fleet-wide sync health