Cost Explorer
The Cost Explorer is the central place to analyze cloud spend. Filter by date range, subscription, and resource type, then explore the data through a set of tabs — trend, service and location breakdowns, top spenders, period comparisons, and workspaces. It re-renders for the selected cloud (Azure or AWS).
Savings Opportunities
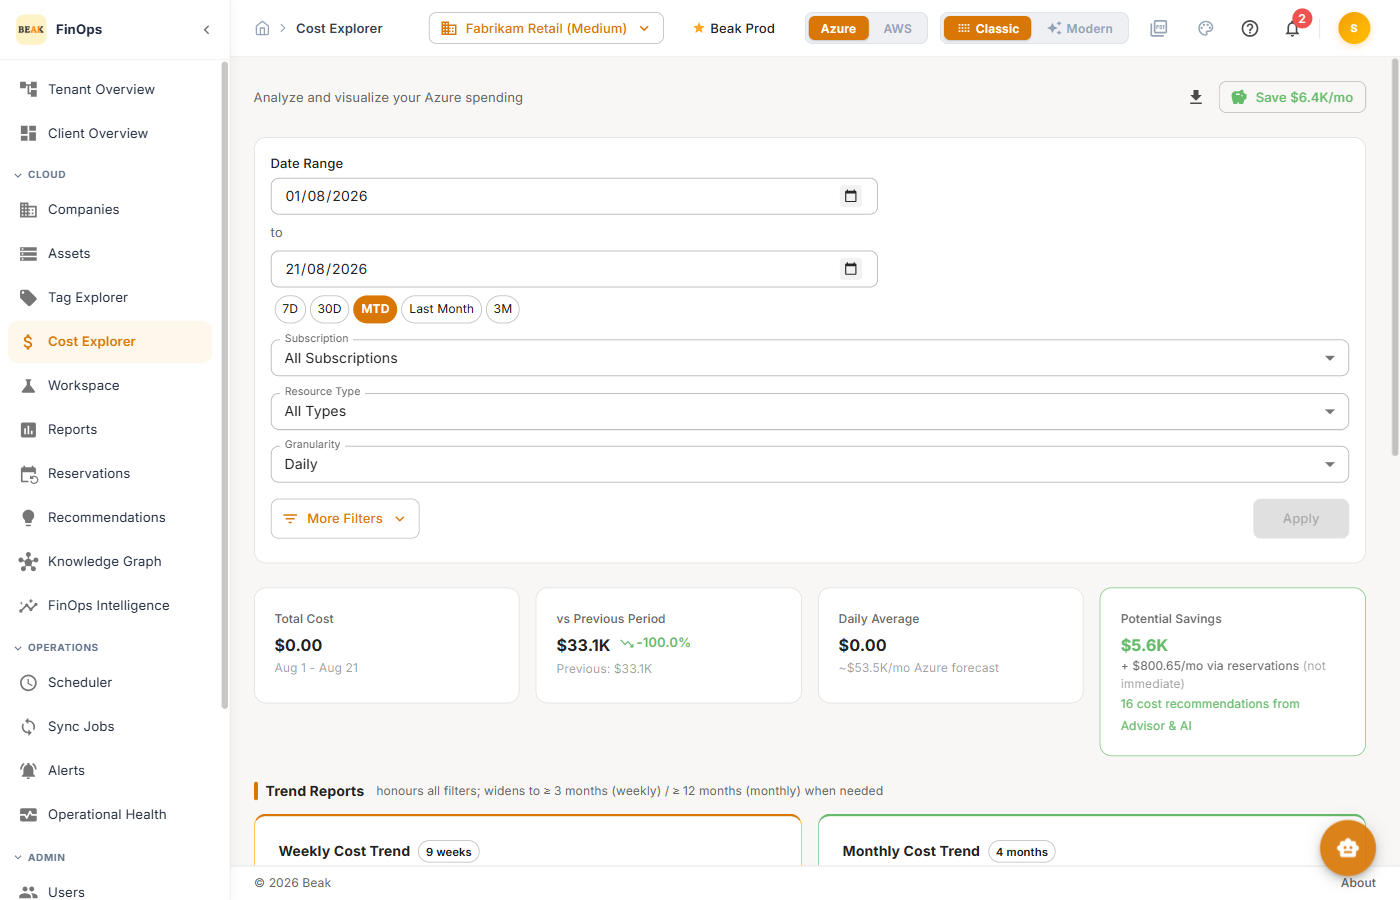
The Save $X/mo button at the top surfaces the estimated monthly savings available from current recommendations — a quick jump from cost analysis into action.
Filters
The filter panel refines every tab:
- Date Range — A custom from/to range, or a quick select:
7D,30D,MTD,Last Month,3M - Subscription — Isolate spend for a specific subscription or account
- Resource Type — Narrow to a resource type (virtual machines, databases, storage, …)
- Granularity — Aggregation interval (for example
Daily) - More Filters — Additional filters such as resource group and tag
Filter changes are staged, not live. Adjust as many as you need, then choose Apply to run them — the button stays disabled until something actually changes, so a re-query only happens when you ask for one.
Tabs
-
Overview — Headline totals (Total Cost, vs. Previous Period, Daily Average, Potential Savings) and trend reports
-
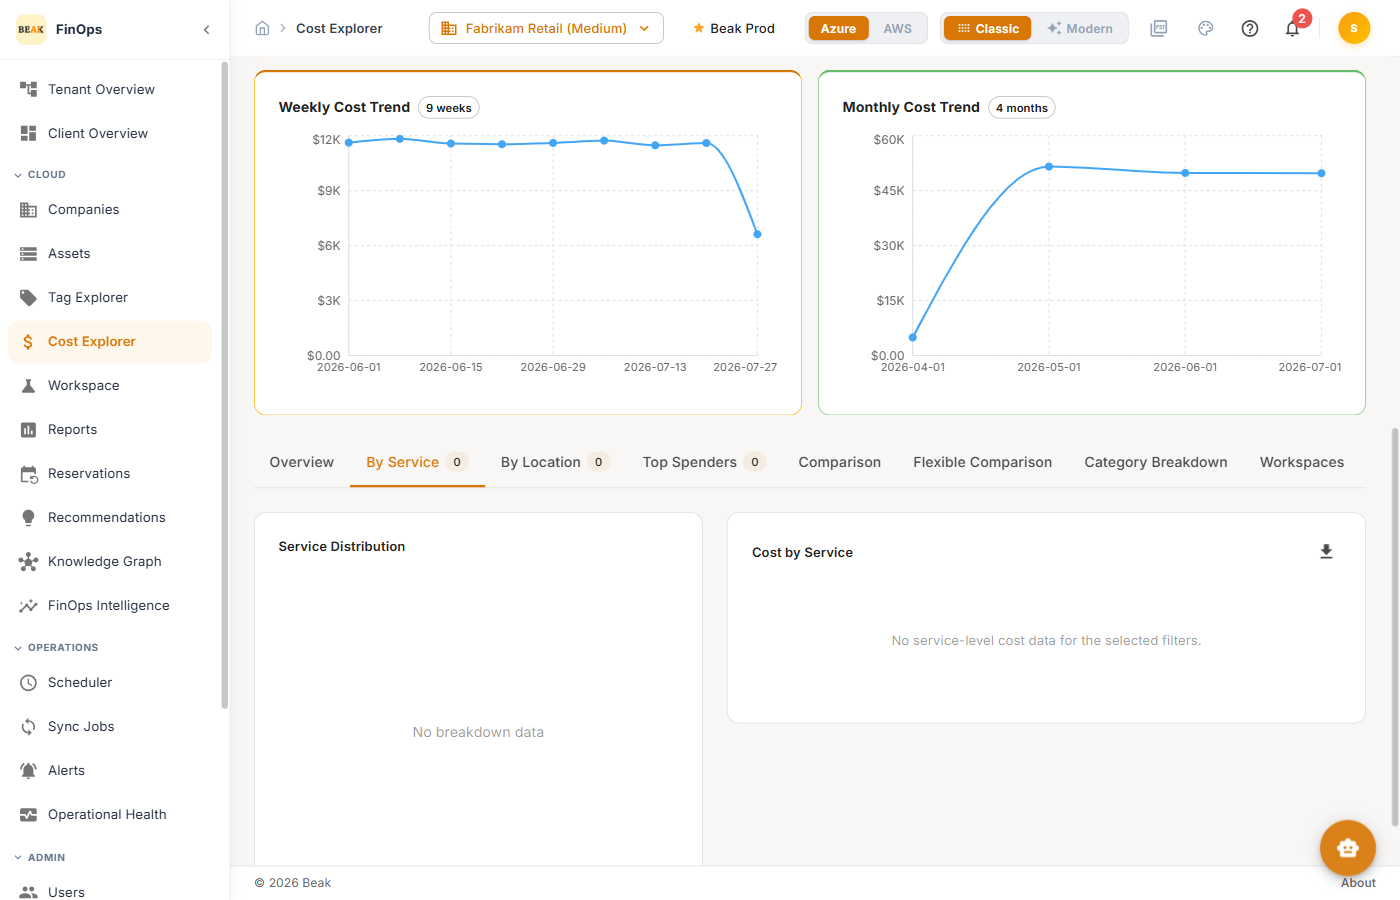
By Service — Spend broken down per cloud service
-
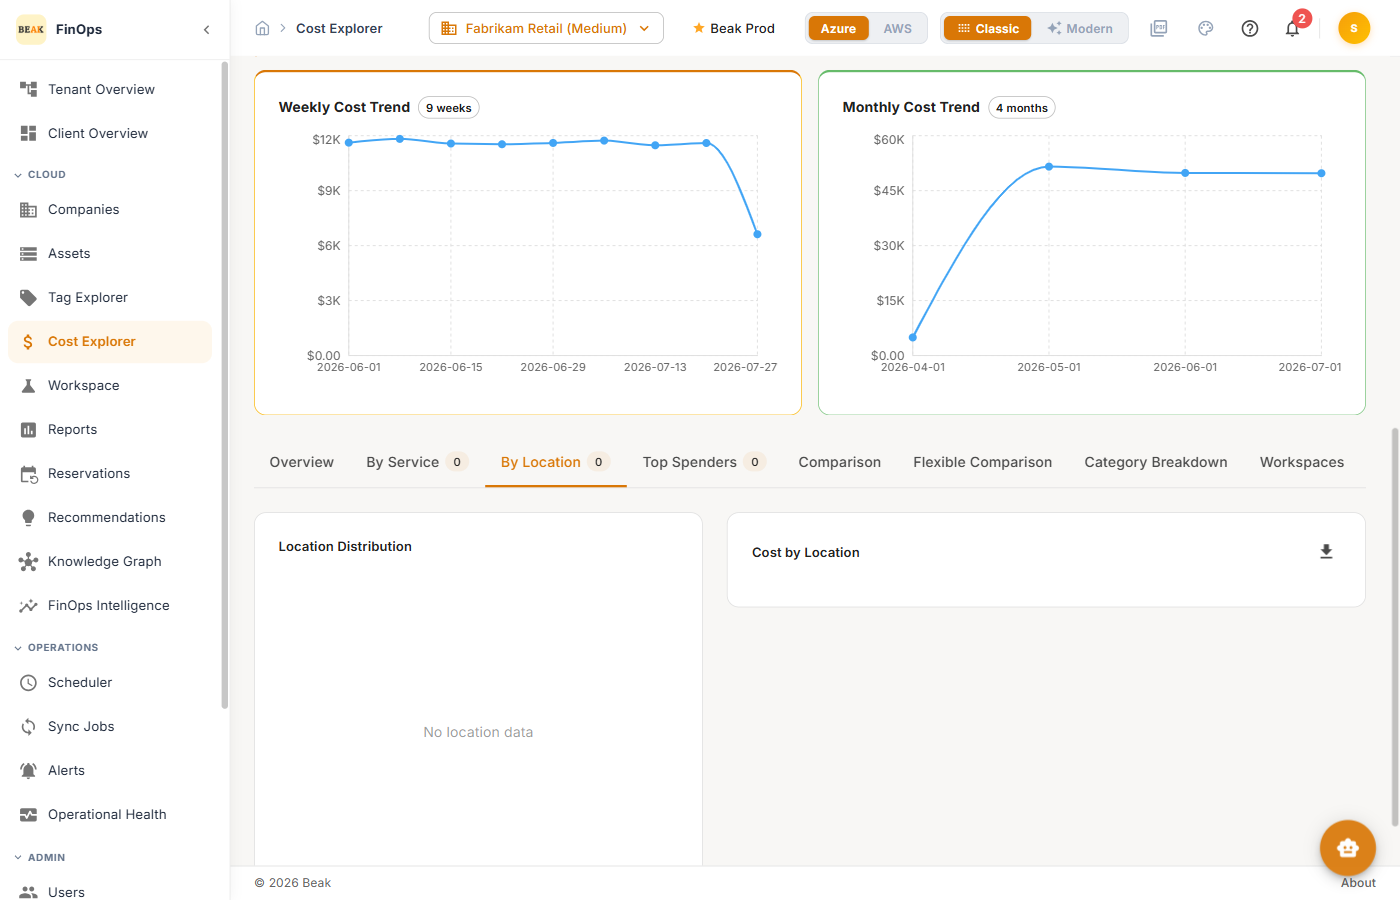
By Location — Spend broken down per region
-
Top Spenders — The highest-cost individual resources
-
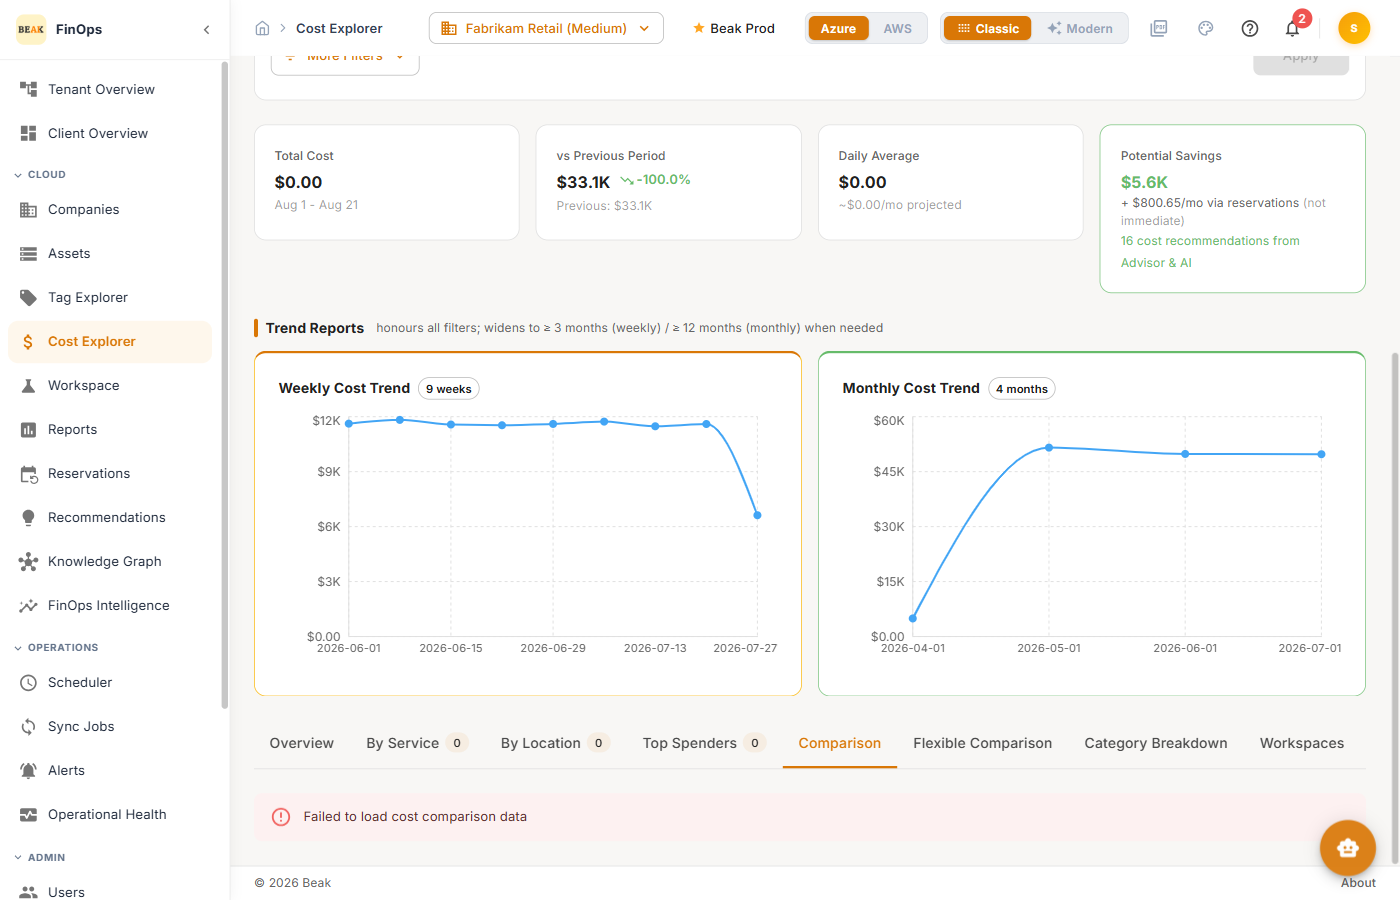
Comparison — Compare two periods side by side
-
Flexible Comparison — Compare arbitrary dimensions and periods
-
Category Breakdown — Spend grouped by category
-
Workspaces — Cost rolled up by workspace. For the full workspace estate — capacity, requests, and per-workspace savings — see Workspaces.
Trend Reports
Below the headline tiles, the Overview tab charts spend over time as Weekly Cost Trend and Monthly Cost Trend. Both honour the filters above them, and each widens its own bucket when the selected range needs it — to weekly at three months or more, and to monthly at twelve months or more — so a long range stays readable instead of collapsing into unusable daily bars.
The forecast is drawn as a dashed line continuing the actuals, and accumulates across the period rather than restating each interval, so the end of the line is the projected total for the period and not the projection for its last bucket.
AWS view
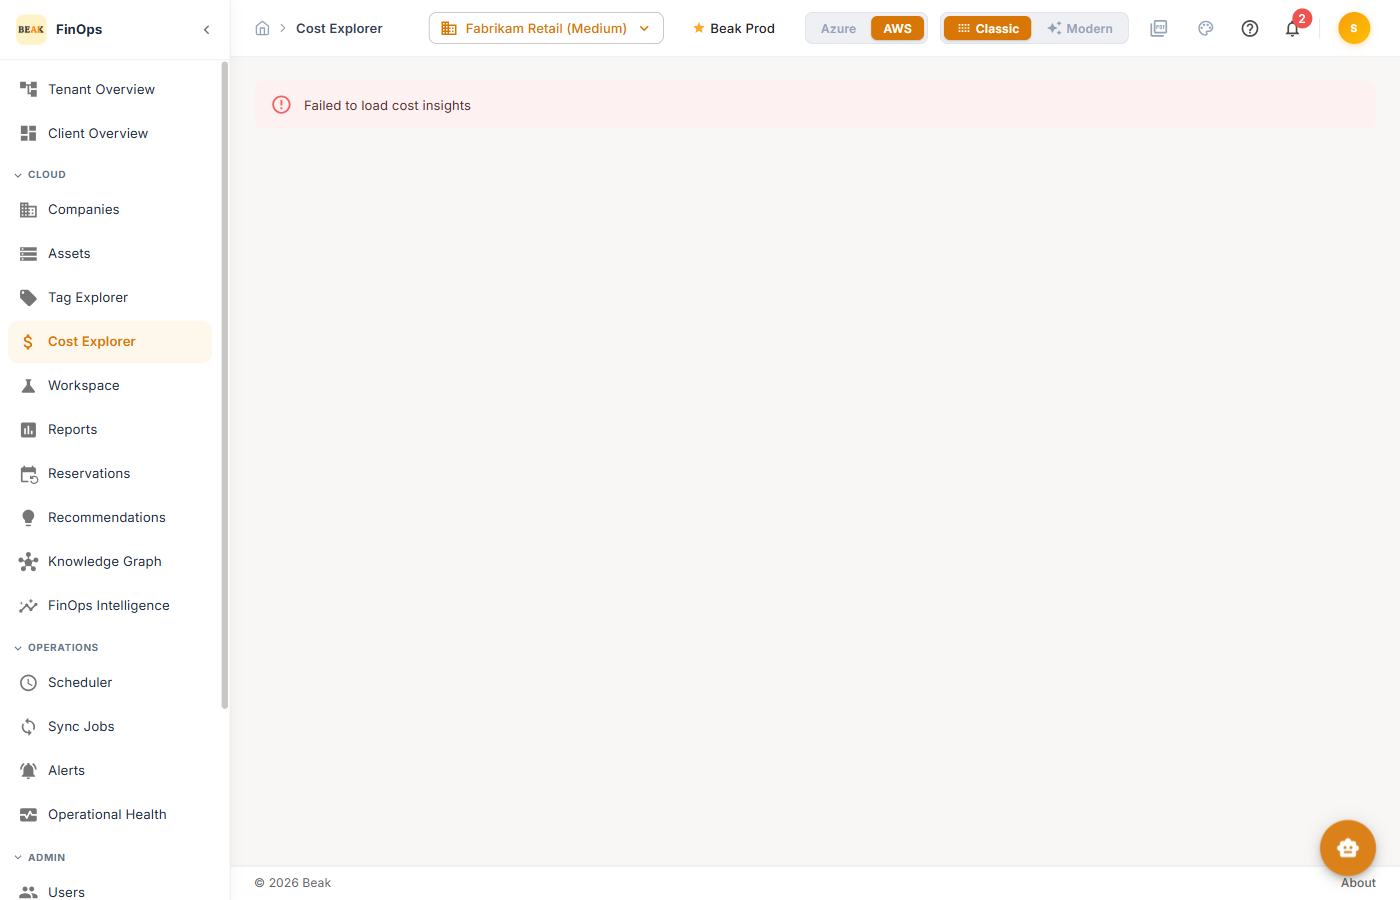
Switch the cloud toggle to AWS to analyze AWS spend, with AWS-native service and region breakdowns.
Modern view
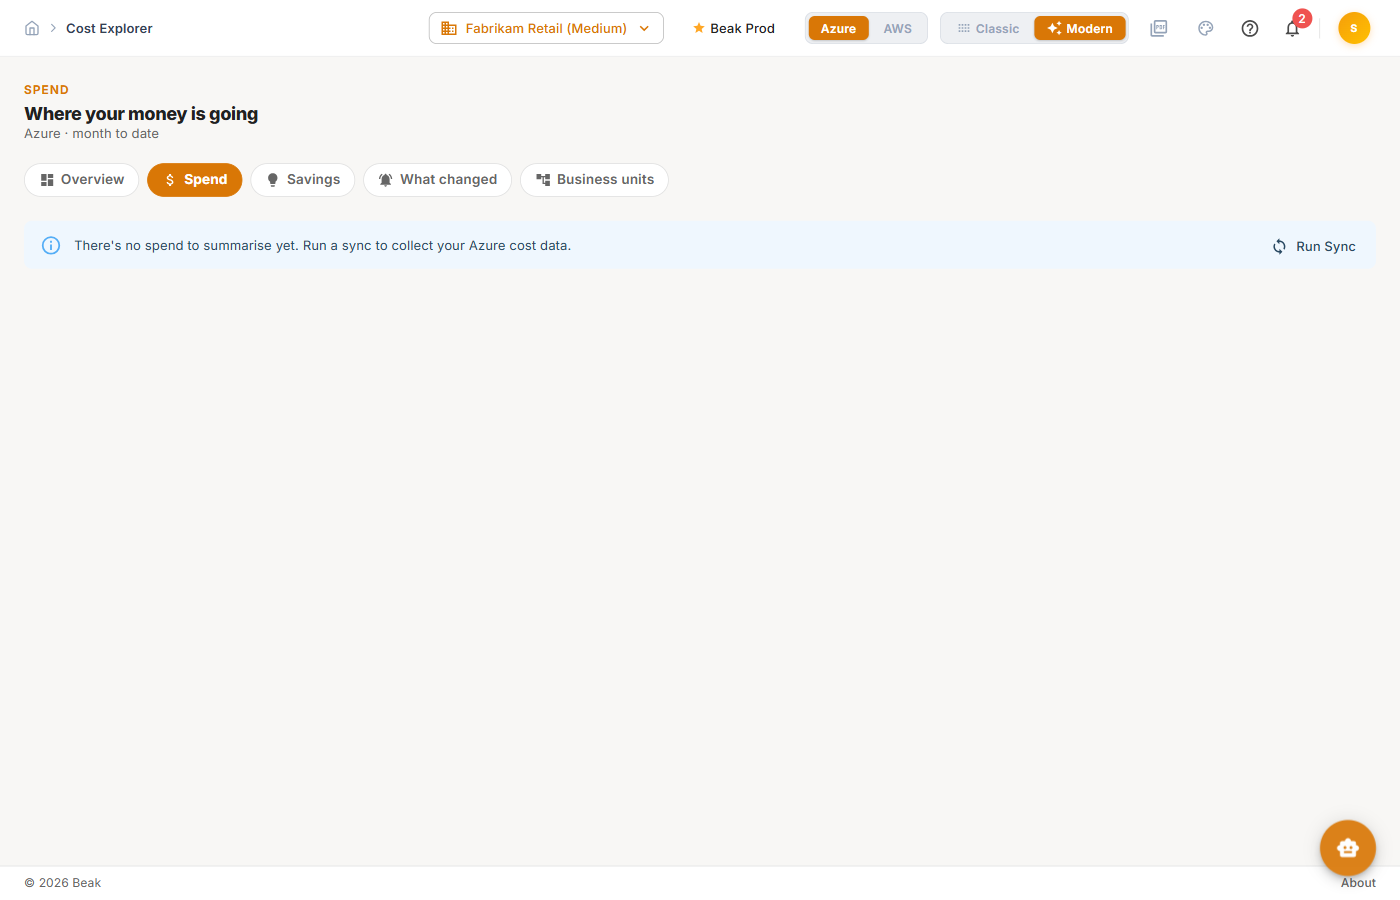
The Modern toggle presents cost analysis as an executive narrative — headline spend, the biggest cost drivers, how spend is trending, and where the money goes.
Best Practices
- Start broad, then filter — Begin on Overview, then use By Service and By Location to find where spend concentrates
- Use Comparison for month-end reviews — Compare the current period against the last to explain movement
- Pivot to action — Follow the Save button into Recommendations when a driver looks optimizable
Related Pages
- Overview — Cost KPIs at a glance
- Reports — Prebuilt cost reports
- Tag Explorer — Spend by tag
- Recommendations — Optimization opportunities